can model averaging solve the meese rogoff puzzle (PDF)
File information
This PDF 1.7 document has been generated by PDFium, and has been sent on pdf-archive.com on 14/04/2018 at 00:01, from IP address 88.98.x.x.
The current document download page has been viewed 739 times.
File size: 1.01 MB (61 pages).
Privacy: public file


File preview
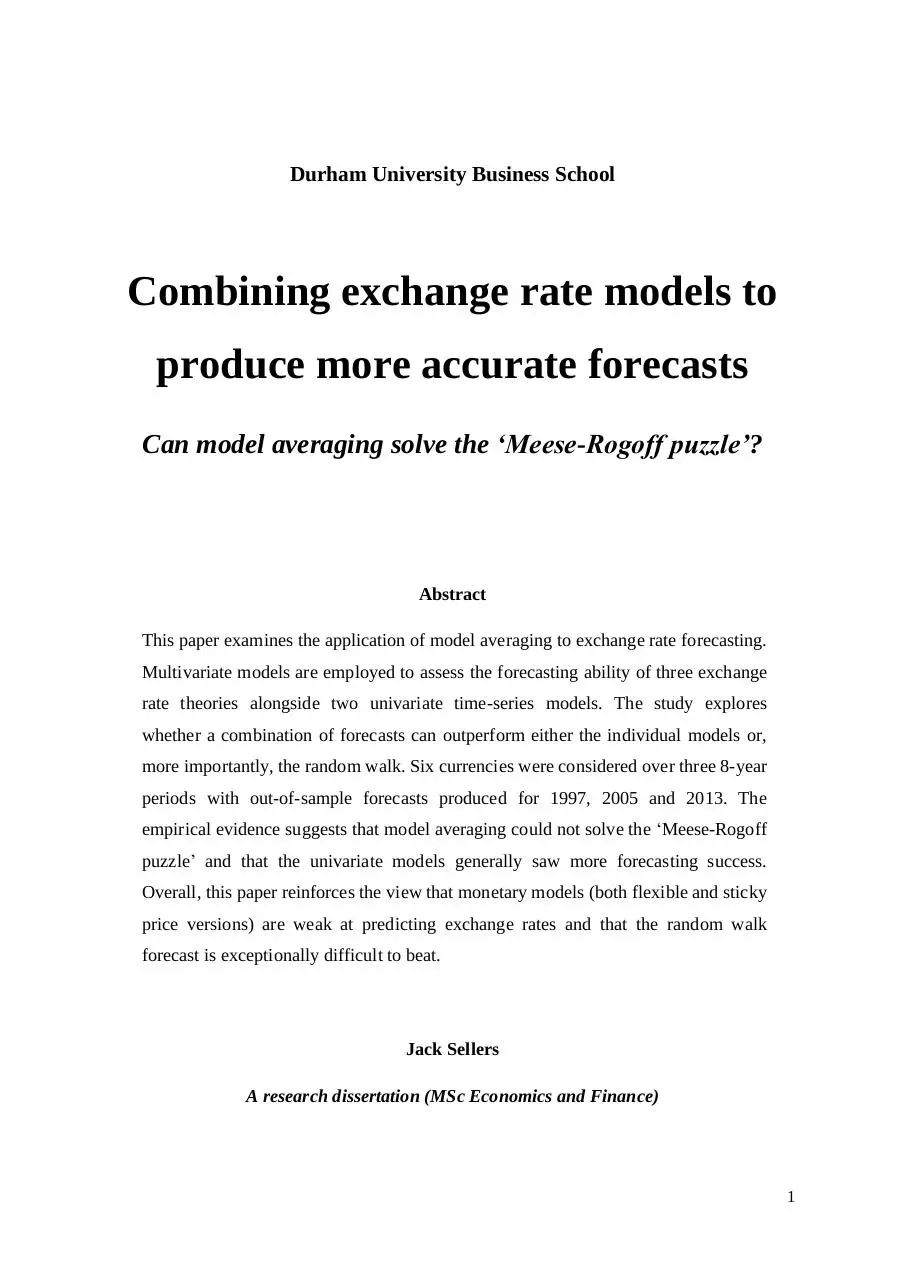
Durham University Business School
Combining exchange rate models to
produce more accurate forecasts
Can model averaging solve the ‘Meese-Rogoff puzzle’?
Abstract
This paper examines the application of model averaging to exchange rate forecasting.
Multivariate models are employed to assess the forecasting ability of three exchange
rate theories alongside two univariate time-series models. The study explores
whether a combination of forecasts can outperform either the individual models or,
more importantly, the random walk. Six currencies were considered over three 8-year
periods with out-of-sample forecasts produced for 1997, 2005 and 2013. The
empirical evidence suggests that model averaging could not solve the ‘Meese-Rogoff
puzzle’ and that the univariate models generally saw more forecasting success.
Overall, this paper reinforces the view that monetary models (both flexible and sticky
price versions) are weak at predicting exchange rates and that the random walk
forecast is exceptionally difficult to beat.
Jack Sellers
A research dissertation (MSc Economics and Finance)
1
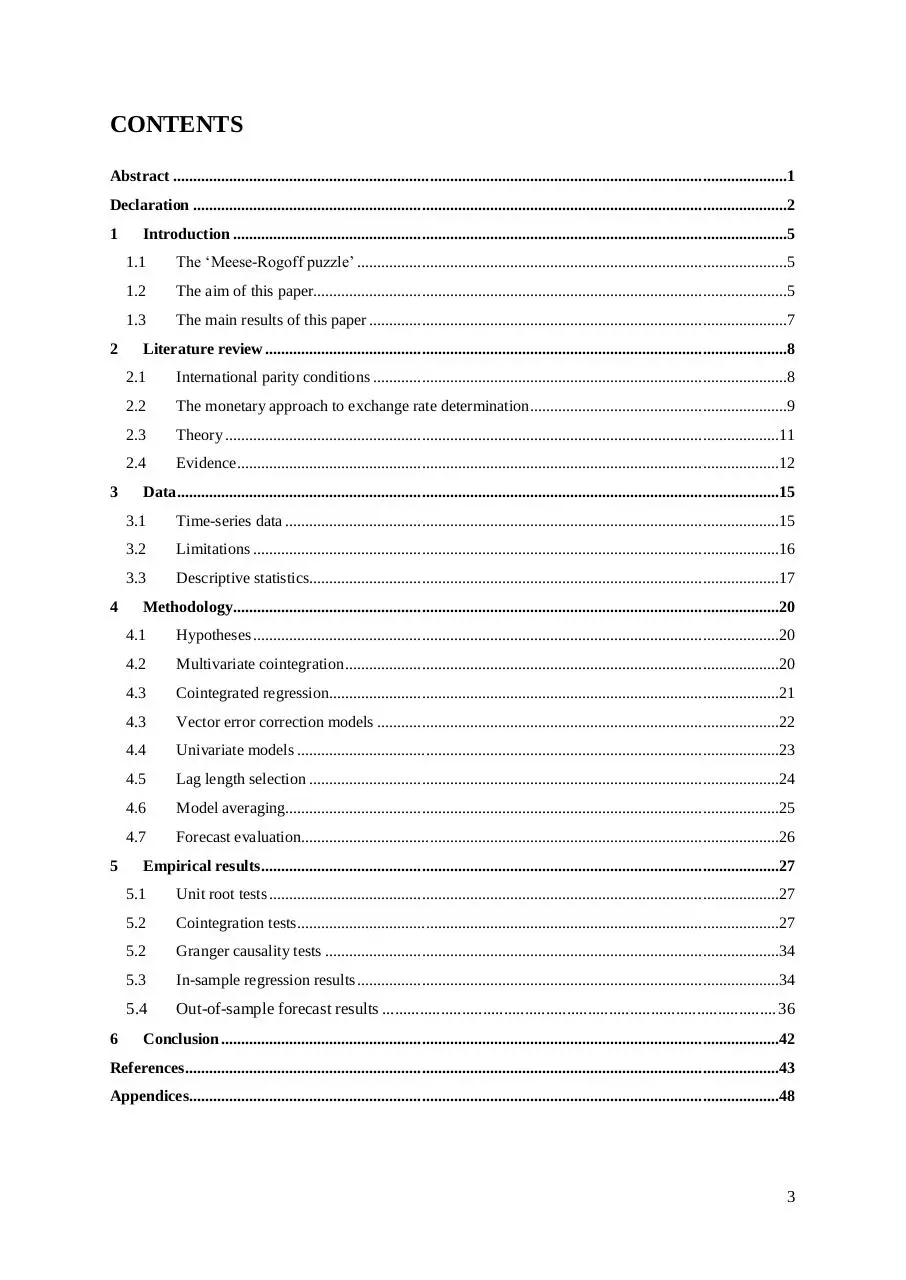
CONTENTS
Abstract .........................................................................................................................................................1
Declaration ....................................................................................................................................................2
1
2
3
4
5
6
Introduction ..........................................................................................................................................5
1.1
The ‘Meese-Rogoff puzzle’ ...........................................................................................................5
1.2
The aim of this paper......................................................................................................................5
1.3
The main results of this paper ........................................................................................................7
Literature review ..................................................................................................................................8
2.1
International parity conditions .......................................................................................................8
2.2
The monetary approach to exchange rate determination ................................................................9
2.3
Theory ..........................................................................................................................................11
2.4
Evidence .......................................................................................................................................12
Data ......................................................................................................................................................15
3.1
Time-series data ...........................................................................................................................15
3.2
Limitations ...................................................................................................................................16
3.3
Descriptive statistics.....................................................................................................................17
Methodology........................................................................................................................................20
4.1
Hypotheses ...................................................................................................................................20
4.2
Multivariate cointegration ............................................................................................................20
4.3
Cointegrated regression ................................................................................................................21
4.3
Vector error correction models ....................................................................................................22
4.4
Univariate models ........................................................................................................................23
4.5
Lag length selection .....................................................................................................................24
4.6
Model averaging...........................................................................................................................25
4.7
Forecast evaluation.......................................................................................................................26
Empirical results .................................................................................................................................27
5.1
Unit root tests ...............................................................................................................................27
5.2
Cointegration tests........................................................................................................................27
5.2
Granger causality tests .................................................................................................................34
5.3
In-sample regression results .........................................................................................................34
5.4
Out-of-sample forecast results .............................................................................................. 36
Conclusion ...........................................................................................................................................42
References ....................................................................................................................................................43
Appendices...................................................................................................................................................48
3
LIST OF FIGURES
3.3a
M1 money supply (rebased to first) .............................................................................................18
3.3b
Real GDP (rebased to first) ..........................................................................................................18
3.3c
Interbank rate (3 month)...............................................................................................................18
3.3d
CPI inflation rate ..........................................................................................................................18
3.3e
Current account balance (rebased to first) ....................................................................................18
5.5a
Forecast performances relative to the random walk .....................................................................40
5.5b
AUD-GBP forecasts (1997 – 2005) .............................................................................................41
LIST OF TABLES
3.3
Descriptive statistics for the logarithmic returns of each currency pair (1989 – 2012) ...............19
5.1a
ADF test results (1) ......................................................................................................................28
5.1b
ADF test results (2) ......................................................................................................................29
5.1c
ADF test results (3) ......................................................................................................................30
5.2a
Cointegration test results and VAR residual diagnostics (1)........................................................31
5.2b
Cointegration test results and VAR residual diagnostics (2)........................................................32
5.2c
Cointegration test results and VAR residual diagnostics (3)........................................................33
5.3a
Summary of Granger causality tests.............................................................................................34
5.3b
Granger causality test results and VAR residual diagnostics (1989 – 2013) ...............................35
5.5a
Ranking the profitability and direction of change predictions (12 months) .................................37
5.5b
Average forecast errors ................................................................................................................37
5.5c
Overall rankings of the models based on forecast error ...............................................................37
5.5d
Average AIC, ∆ and weights ........................................................................................................38
5.5e
RMSE and variance by forecast period ........................................................................................40
LIST OF APPENDICES
I
Data sources .................................................................................................................................48
II
FM-OLS .......................................................................................................................................49
III
DOLS ...........................................................................................................................................50
IV
Direction of change and profit/loss of each trade (12 months) ....................................................51
V
VECM and ARMA specifications................................................................................................52
VI
RMSE results for each forecast ....................................................................................................55
VII
MAE results for each forecast ......................................................................................................58
VIII
AIC, ∆ and weights ......................................................................................................................61
4
1. INTRODUCTION
1.1 The ‘Meese-Rogoff puzzle’
Conventional wisdom dictates that exchange rates are influenced by macroeconomic events.
A change in a nation’s fundamentals should, ceteris paribus, lead to a change in their
currency’s value. Yet, as the data often shows us, conventional wisdom can be misleading. In
their seminal papers, Meese and Rogoff (1983a,b) were among the first to describe the failure
of economic theory at predicting exchange rates. Their results suggested that structural
models based on macroeconomic variables were unable to outperform the random walk
forecast1. This quandary is known as the ‘Meese-Rogoff puzzle’ and has since inspired many
researches to find innovative ways of solving it.
Before addressing the puzzle, it is important to understand what might make exchange rates
more difficult to predict. The foreign exchange market is decentralised, operates around the
clock and sees greater liquidity than any other market 2 . Greater market efficiency could,
therefore, be one explanation of unpredictability. However, this is difficult to measure and
seems like a somewhat unsatisfactory answer, as it does not necessarily imply a disparity
between exchange rates and their fundamentals. Explanations of the Meese-Rogoff puzzle
tend to come from elsewhere, focusing on the shortcomings of the structural models, nonlinearities in the data, sampling error and model misspecification. Yet, despite the numerous
studies aimed at finding a consistent predictor of exchange rates, it is clear how inconsistent
the results have been. Currency forecasters must successfully choose the right model, sample
period, data frequency and estimation method before seeing any progress and even then, their
model’s forecasting ability may not hold in other periods.
1.2 The aim of this paper
Meese and Rogoff carried out their first study in 1983, only looking at 3 currency pairs over a
short time period. Since then, there have been a number of similar studies but with varying
results, hence the difficulty in drawing overall conclusions about the monetary models’
forecasting abilities. This paper aims to provide a more extensive investigation of the MeeseRogoff puzzle whilst considering a combination of the forecasts and how it compares to that
of the random walk. Indeed, Meese and Rogoff also attempted to combine their forecasts
1
2
The random walk forecast essentially predicts no change in price (tomorrow’s price will be equal to today’s)
The Bank for International Settlements (BIS) estimated daily turnover to be $5.3 trillion in 2013
5
using a different method, but still failed to beat the random walk. Due to the discrepancies in
the literature, it was important to consider multiple currencies in this study. Many studies
have claimed success in predicting a small number of exchange rates, only for their results to
be rejected by larger studies across numerous currencies. Furthermore, it was not sufficient to
simply consider each currency’s relationship with the US dollar, as most papers have focused
on. In order to get a more complete appreciation of how currencies interact with
macroeconomic fundamentals, this study sets itself apart from the literature by examining
each combination of currency pairs within six free-floating currencies. By doing so, the aim
was to examine a more general application of the structural models that did not rely
exclusively on dollar exchange rates, since the dollar is the world reserve currency and may
not necessarily behave according to established economic principles. There are multitudes of
cross country trade and investment patterns that cannot be captured by comparing each
country’s fundamentals to those of the USA. Lastly, it may also be informative to see how
major currency pairs differ in behaviour and relation to their fundamentals, relative to minor
currency pairs, where greater liquidity in the former could result in less predictability. Of the
225 forecasts produced in this study (not including the benchmarks), 135 were of the
structural models and 90 were of the univariate models.
The variables in question underwent unit root and cointegration tests, revealing the existence
of long-run relationships in the data. This motivated the decision to use vector error
correction models (VECMs) as the preferred method of estimating the structural forecasts,
with stationary vector autoregressive (VAR) models used when cointegration was not
observed. In addition, two univariate models; an autoregressive moving average (ARMA)
model
and
a
generalised
autoregressive
conditional
heteroscedasticity (GARCH)
specification are also employed to capture the effects of “chartists” in the market, those who
simply rely on past trends in a currency pair’s price. Together, there were five forecasts
produced for each sample period alongside the random walk (RW) and random walk with
drift (RWD) forecasts acting as benchmarks. To evaluate the forecasts, both the root mean
squared errors (RMSEs) and mean absolute errors (MAEs) are evaluated, with average values
for these over all of the 45 samples (15 currency pairs over 3 time periods) and for each
forecast horizon. The method chosen for model averaging gives weights to each forecast
based on the Akaike Information Criterion (AIC), which acts as a measure of its quality.
6
1.3 The main findings of this paper
Overall, the structural models failed to shed their reputations as poor out-of-sample
forecasters. Interestingly, however, the univariate models tended to produce more accurate
predictions, with an ARMA-GARCH(1,1) model dominating the 12 month forecasts.
Nevertheless, none of the models in this study can be endorsed as consistent exchange rate
predictors. A currency trader would have incurred significant losses by following any of the
models and could not even count on them for a correct direction of change prediction.
Moreover, the combined forecasts fared better than the structural models’ due to the inclusion
of the univariate models, rather than for being an effective method for averaging forecasts.
AIC proved to be a poor measure of quality as the weights for each model tended to be very
similar, equating the technique to a naïve strategy of equal weighting. All in all, the results
raise doubt over the validity of these structural models, echoing the scepticism that Meese
and Rogoff brought into the exchange rate forecasting literature.
The paper is arranged as follows; section 2 looks at the derivation of the monetary models
and how they have been interpreted, both theoretically and empirically. Section 3 describes
the data used in this study, along with its characteristics and limitations. Section 4 outlines
the full methodology employed by this study with section 5 assessing its results. Finally, a
brief conclusion of the results is found in section 6, with references and appendices thereafter.
7
2. LITERATURE REVIEW
The following chapter considers the existing literature on exchange rate forecasting, with the
first three sections looking at the theoretical background of the monetary models and what
researchers have had to say about them since their inception. The final section focuses on the
empirical evidence produced by researchers who have tested such models, and how their
results have differed.
2.1 International parity conditions
Identifying the factors that drive exchange rates is a challenge in itself. The traditional
approach to modelling exchange rates comes from looking at parity conditions in the goods
market. Purchasing power parity (PPP) was developed as a rudimentary way of evaluating
currency values relative to one another, given free trade conditions and an absence of
transaction costs. Its usefulness at explaining exchange rates has been questioned repeatedly
throughout the last century, although Taylor (2003) notes a recent move towards accepting
PPP over the long-run. The PPP equation is
(1)
where St is the spot exchange rate, Pt is the domestic price level and Pt* is the foreign price
level3. Also, interest rates have been a key part of many exchange rate theories, most notably
in the uncovered interest rate parity (UIP) which defines a no-arbitrage condition between
countries with different rates of return on bank deposits. The UIP equation is
(2)
with ∆Ste denoting the expected depreciation of the domestic currency and it being the interest
rate. Covered interest rate parity (CIP) extends this concept to include forward contracts as a
way of mitigating exchange rate risk, since one can assume that some countries will face a
risk premium regardless of the rates they offer. In general, CIP holds for recent sample
periods in countries where capital controls have been removed, and deviations from the parity
3
Throughout this paper, all capital lettered variables are logarithmic and all foreign variables are denoted with *
8
condition are short lived (Coffey et al., 2009). Yet neither the goods nor interest rate markets
provide a complete explanation of exchange rates. For example, current account balances
have been studied extensively as a potential sign of a currency’s strength, even though the
increasing role of capital market activity in the foreign exchange market may have since
rendered this as a less important factor (Krueger, 1983). Determining which factors to include
is far from straightforward, but there is something instinctive about applying economic
“truths” to exchange rate prediction. Whether they hold true in reality or not is another matter.
2.2 The monetary approach to exchange rate determination
It is desirable, therefore, for an exchange rate model to incorporate multiple dynamics whilst
remaining parsimonious 4 enough for out-of-sample forecasts. The monetary approach to
exchange rate modelling satisfies these prerequisites, building from the PPP condition and
allowing for other variables to be introduced. The reasoning behind this approach is to
analyse the determinants of exchange rates in terms of the supply and demand for both assets
(Frenkel, 1976). In the flexible-price version, monetary equilibrium is given by
(3)
(4)
where Mt is the money supply and Yt is the level of real income. Since PPP is assumed to
hold, equations (3) and (4) can be substituted into (1) to get
(5)
Allowing the domestic and foreign coefficients of income and interest rates to be equal
( = *, = *), we get the model of Frenkel (1976) and Bilson (1978a) (hereafter FB model)
(6)
4
The idea of parsimony here means to achieve a desired outcome while keeping the number of model
parameters as low as possible.
9
Dornbusch (1976) provided an alternative to this model by contesting the assumption of
flexible prices. In his sticky-price version, PPP only holds in the long-run which means that
the FB equation also only holds in the long-run (long-run variables are given an overline)
̅
̅
̅
̅
̅
̅
̅
(7)
The exchange rate should, therefore, deviate from its equilibrium value over the short-run,
subject to market expectations of future inflation (π). The expected depreciation of the
domestic currency can, thus, be expressed in terms of the difference between the long and
short-run exchange rate and the long-run inflation rate differential
̅
̅
̅
(8)
Combining the UIP condition (2) with equation (8), we are left with an expression for the
difference between the short and long-run exchange rates
̅
[
̅
̅
(9)
which can be combined with equation (7) to get the Dornbusch overshooting model
̅
(̅
̅ )
(̅
̅ )
̅
̅
(10)
Frankel (1979) extends this model to incorporate secular (persistent) inflation and simplifies
the last two coefficients to single values. This is known as the Dornbusch-Frankel model
(hereafter DF model)
̅
(̅
̅ )
(̅
̅ )
̅
̅
(11)
10
Download can-model-averaging-solve-the-meese-rogoff-puzzle
can-model-averaging-solve-the-meese-rogoff-puzzle.pdf (PDF, 1.01 MB)
Download PDF
Share this file on social networks
Link to this page
Permanent link
Use the permanent link to the download page to share your document on Facebook, Twitter, LinkedIn, or directly with a contact by e-Mail, Messenger, Whatsapp, Line..
Short link
Use the short link to share your document on Twitter or by text message (SMS)
HTML Code
Copy the following HTML code to share your document on a Website or Blog
QR Code to this page

This file has been shared publicly by a user of PDF Archive.
Document ID: 0000756639.