School District Socioeconomic Status, Race, and Academic Achievement (PDF)
File information
Title: Microsoft Word - district ses and achievement paper v02.docx
Author: Sean Reardon
This PDF 1.5 document has been generated by PScript5.dll Version 5.2.2 / Acrobat Distiller 11.0 (Windows), and has been sent on pdf-archive.com on 30/10/2019 at 03:38, from IP address 68.1.x.x.
The current document download page has been viewed 974 times.
File size: 749.38 KB (13 pages).
Privacy: public file


File preview
School District Socioeconomic Status, Race, and Academic Achievement
Sean F. Reardon
Stanford University
Preliminary Draft, for discussion
Version: April, 2016
The research described here was supported by grants from the Institute of Education Sciences
(R305D110018), the Spencer Foundation, and the William T. Grant Foundation. The paper would not have
been possible without the assistance of Ross Santy, Michael Hawes, and Marilyn Seastrom, who
facilitated access to the EdFacts data. This paper benefitted substantially from ongoing collaboration with
Andrew Ho, Demetra Kalogrides, Kenneth Shores, Erin Fahle, and Ben Shear. Some of the data used in this
paper were provided by the National Center for Education Statistics (NCES). The opinions expressed here
are my own and do not represent views of NCES, the Institute of Education Sciences, the Spencer
Foundation, the William T. Grant Foundation, or the U.S. Department of Education. Direct
correspondence and comments to Sean F. Reardon, sean.reardon@stanford.edu, 520 CERAS Building
#526, Stanford University, Stanford, CA 94305.
1
School District Socioeconomic Status, Race, and Academic Achievement
How much does academic performance vary among school districts and communities in the U.S.?
How much of that variation is due to the socioeconomic context of the schools and the socioeconomic
background of the students? How do test scores vary by race within and between districts?
This short report uses new data from the Stanford Education Data Archive to investigate these questions.
It is a working draft that will be updated in the next few weeks. The intended purpose is to highlight key
patterns of academic achievement across the country; in future papers I will add additional more detailed
analyses.
Test Score Data
The test score data used here come from the Stanford Education Data Archive (SEDA), which
includes estimates of the average test scores of students in almost every public school district in the
United States (seda.stanford.edu). These estimates are based on roughly 215 million state accountability
test scores (representing more than 40 million students) on math and English Language Arts (ELA) tests in
grades 3‐8 in the years 2009‐2013 in every public school district in the United States. Details on the
source and construction of the estimates is available on the SEDA website.
The scores are placed on a common scale across states, grades, and years, so that performance
can be meaningfully compared across places. The scale I use here is one in which test scores are
standardized in relation to the average national performance for each grade level. Although scores are
available for each school district in each year from 2009 to 2013 and each grade from 3 to 8, I use a
version of the SEDA data that averages these scores across grades and years to create a single average
score for each district; I also pool the scores across math and ELA for presentational simplicity, since the
two are very highly correlated at the district level. The resulting measure is scaled so that a value of 0
2
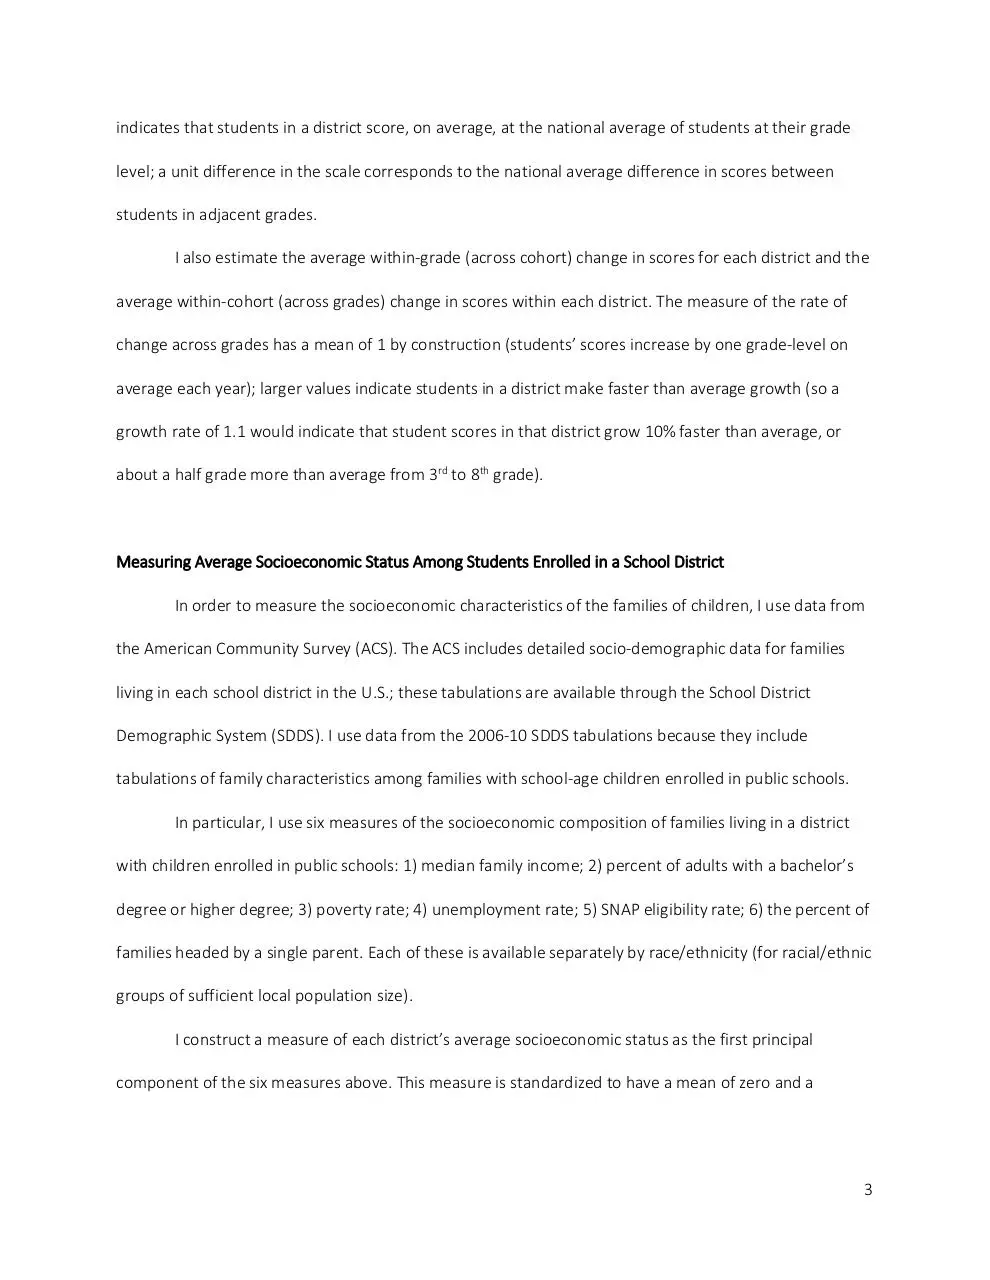
indicates that students in a district score, on average, at the national average of students at their grade
level; a unit difference in the scale corresponds to the national average difference in scores between
students in adjacent grades.
I also estimate the average within‐grade (across cohort) change in scores for each district and the
average within‐cohort (across grades) change in scores within each district. The measure of the rate of
change across grades has a mean of 1 by construction (students’ scores increase by one grade‐level on
average each year); larger values indicate students in a district make faster than average growth (so a
growth rate of 1.1 would indicate that student scores in that district grow 10% faster than average, or
about a half grade more than average from 3rd to 8th grade).
Measuring Average Socioeconomic Status Among Students Enrolled in a School District
In order to measure the socioeconomic characteristics of the families of children, I use data from
the American Community Survey (ACS). The ACS includes detailed socio‐demographic data for families
living in each school district in the U.S.; these tabulations are available through the School District
Demographic System (SDDS). I use data from the 2006‐10 SDDS tabulations because they include
tabulations of family characteristics among families with school‐age children enrolled in public schools.
In particular, I use six measures of the socioeconomic composition of families living in a district
with children enrolled in public schools: 1) median family income; 2) percent of adults with a bachelor’s
degree or higher degree; 3) poverty rate; 4) unemployment rate; 5) SNAP eligibility rate; 6) the percent of
families headed by a single parent. Each of these is available separately by race/ethnicity (for racial/ethnic
groups of sufficient local population size).
I construct a measure of each district’s average socioeconomic status as the first principal
component of the six measures above. This measure is standardized to have a mean of zero and a
3
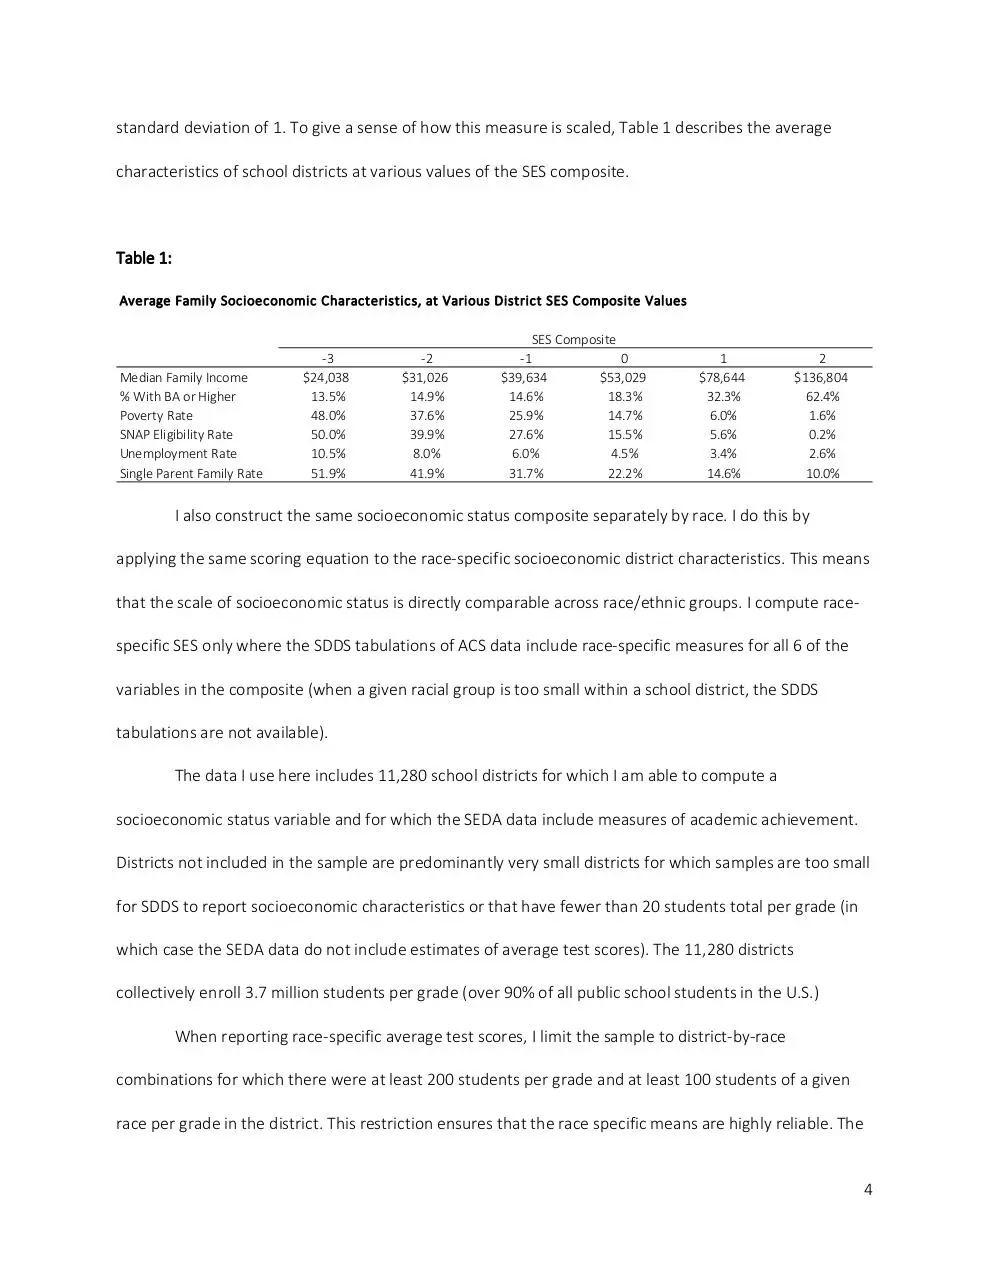
standard deviation of 1. To give a sense of how this measure is scaled, Table 1 describes the average
characteristics of school districts at various values of the SES composite.
Table 1:
Average Family Socioeconomic Characteristics, at Various District SES Composite Values
Median Family Income
% With BA or Higher
Poverty Rate
SNAP Eligibility Rate
Unemployment Rate
Single Parent Family Rate
‐3
$24,038
13.5%
48.0%
50.0%
10.5%
51.9%
‐2
$31,026
14.9%
37.6%
39.9%
8.0%
41.9%
SES Composite
‐1
0
$39,634
$53,029
14.6%
18.3%
25.9%
14.7%
27.6%
15.5%
6.0%
4.5%
31.7%
22.2%
1
$78,644
32.3%
6.0%
5.6%
3.4%
14.6%
2
$136,804
62.4%
1.6%
0.2%
2.6%
10.0%
I also construct the same socioeconomic status composite separately by race. I do this by
applying the same scoring equation to the race‐specific socioeconomic district characteristics. This means
that the scale of socioeconomic status is directly comparable across race/ethnic groups. I compute race‐
specific SES only where the SDDS tabulations of ACS data include race‐specific measures for all 6 of the
variables in the composite (when a given racial group is too small within a school district, the SDDS
tabulations are not available).
The data I use here includes 11,280 school districts for which I am able to compute a
socioeconomic status variable and for which the SEDA data include measures of academic achievement.
Districts not included in the sample are predominantly very small districts for which samples are too small
for SDDS to report socioeconomic characteristics or that have fewer than 20 students total per grade (in
which case the SEDA data do not include estimates of average test scores). The 11,280 districts
collectively enroll 3.7 million students per grade (over 90% of all public school students in the U.S.)
When reporting race‐specific average test scores, I limit the sample to district‐by‐race
combinations for which there were at least 200 students per grade and at least 100 students of a given
race per grade in the district. This restriction ensures that the race specific means are highly reliable. The
4
sample includes 1,514 districts for which SEDA includes average test scores for white students; 946 with
scores for black students; and 1,115 with scores for Hispanic students. These districts include 46% of all
white students; 78% of all black students; and 74% of all Hispanic students.
Table 2 below describes the average socioeconomic composite values among districts, weighted
by each race/ethnic group’s enrollment. The top row indicates the average SES among all 11,280 districts
in our sample, weighted by racial/ethnic enrollment. The average white student is enrolled in a district
with SES levels 0.94 standard deviations higher than the average black student; and 0.63 standard
deviations higher than the average Hispanic student. Among the 1,514 districts for which I have white
mean scores, the average white student is in a district where the average SES is 0.17, but where the
average SES among white students is 0.56. In other words, white students typically attend school districts
where their white peers are from more advantaged families than their non‐white peers. The pattern is
the opposite for black and Hispanic students. The average black student attends school in a district where
her black peers are far poorer than her non‐black peers; the same holds for Hispanics though the
discrepancy is not as large.
These between‐ and within‐district discrepancies are important for understanding between‐ and
within‐district racial disparities in academic achievement, as we shall see below.
Table 2:
Average District Socioeconomic Characteristics, by Race/Ethnic Group
Average District SES (in all Districts)
Average District SES (in Race Sample Districts
Average SES of Same‐Race in District
N (districts)
White
0.30
0.17
0.56
1514
Group
Black
‐0.64
‐0.63
‐1.99
946
Hispanic
‐0.33
‐0.28
‐0.96
1115
Note: Means are weighted by race‐specific district enrollment.
5
Average Academic Performance, by School District Socioeconomic Status
I begin by examining the pattern of association between district socioeconomic status and
average academic achievement. Before doing so, it is important to note that average test scores in a
district should not be interpreted as a measure of school quality. Test scores and academic performance
more generally are shaped by many factors other than schools. They are shaped by children’s families,
their home environments, their neighborhood contexts, their child care and pre‐school experiences,
afterschool experiences, and by their schools. Knowing that children in a particular community scored
higher, on average, than those in another community does not tell us that the schools were better in that
community. Average test scores are more appropriately interpreted as a measure of the educational
opportunities available to children living within a district. Moreover, while math and ELA test scores are a
proxy for the desired outcomes of schooling; they do not measure all aspects of child development that
students, parents, and society value.
With that in mind, Figure 1 plots the average test scores in each of the 11,280 school districts,
Figure 1
Academic Achievement and Socioeconomic Status
4
3
2
1
0
‐1
‐2
‐3
‐4
‐5
‐4
‐3
‐2
‐1
0
1
2
3
Average Achievement (Grade Levels)
US School Districts, 2009‐2013
<‐‐‐‐‐ Poor/Disadvantaged ‐‐‐‐‐‐‐‐‐‐‐‐‐‐‐‐‐‐‐ Affluent/Advantaged ‐‐‐‐‐>
6
against the average SES level of the students enrolled in the district. The bubbles in the plot are weighted
by the size of the district.
Several things are striking in this figure. First is the obvious, and very strong, relationship between
district socioeconomic status and average academic achievement. The district‐level correlation between
the two is 0.78; the student level correlation (that is, the correlation weighted by district enrollment), is
0.84. Students in many of the most advantaged school districts have test scores that are more than four
grade levels above those of students in the most disadvantaged districts. The socioeconomic context of a
school district is a very powerful predictor of students’ academic performance
Of the 1,000 poorest districts in the U.S., only 68 (6.8%) have mean test scores at or above the
national average. These are mostly small districts; they collectively enroll about 7,000 students per grade
(less than two‐tenths of one percent of all students in the U.S.). Likewise, of the 1,000 most affluent
districts in the U.S., only 16 (1.6% of districts, collectively enrolling fewer than 1,000 students per grade)
have mean test scores at or below the national average. In other words, we have little evidence that we
know how to provide adequate educational opportunities for children growing up in low‐income
communities.
Second is the fact that, despite this strong association between SES and average academic
performance, there are school districts with the same level of SES but with meaningfully different average
test scores. The residual standard deviation around the fitted regression curve in Figure 1 is 0.64. Roughly
5 percent of districts have average scores more than one grade level above what we would predict based
on their socioeconomic status; another 5 percent have average scores more than one grade level below
what I would predict. This variation is not confined to small districts; even among large school districts
(highlighted in Figure 2), there is substantial variation in average test score among school districts with
similar socioeconomic profiles.
7
Figure 2
Academic Achievement and Socioeconomic Status
4
3
2
1
0
‐1
‐2
‐3
‐4
‐5
‐4
‐3
‐2
‐1
0
1
2
3
Average Achievement (Grade Levels)
100 Largest US School Districts, 2009‐2013
<‐‐‐‐‐ Poor/Disadvantaged ‐‐‐‐‐‐‐‐‐‐‐‐‐‐‐‐‐‐‐ Affluent/Advantaged ‐‐‐‐‐>
Racial/Ethnic Differences in Average Achievement
Figure 1 shows the average performance of all students in each school district. But even within
the same district, there are large racial differences in average achievement. In Figure 3, each bubble
corresponds to a race/ethnic group within a specific school district. The points are plotted against the
average district SES (of all students). So one can think of this figure as taking each point in Figure 1, and
breaking it into multiple bubbles, each of which is placed vertically above or below the overall district dot
in accordance with that groups’ average test scores.
Note that the only points shown here are those cases where there are at least 100 students of a
given race per grade in a district, and where there are at least 200 students per grade overall in the
district. Many districts are too small to meet this threshold, and even among those with at least 200
students, many do not have more than one group with at least 100 students per grade. Therefore many
8
districts do not appear at all in Figure 3; some appear only for one race; others appear for two or three
groups.
Figure 3 illustrates that the racial achievement gaps are very large, even among students of
different race/ethnicities who attend schools with similar socioeconomic conditions. The vertical distance
between the three groups is quite large. On average white students score one and half or more grade
levels higher than black and Hispanic students enrolled in socioeconomically similar school districts.
The other striking feature of Figure 3 is that there are very few school districts where black
students score, on average, at or above the national average. In fact, of the 946 school districts with at
least 100 black students per grade, there are only 18 districts, enrolling a total of roughly 3000 black
students per grade (one half of one percent of all black students in the U.S.) in which black students’
average test scores are at or above the national average.
Figure 3
US School Districts With 100+ Students of a Given Race/Ethnicity, 2009‐2013
4
3
2
1
0
‐1
‐2
White Students
Hispanic Students
Black Students
‐3
‐4
‐5
‐5
‐4
‐3
‐2
‐1
0
1
2
3
<‐‐‐‐‐ Poor/Disadvantaged ‐‐‐‐‐‐‐‐‐‐‐‐‐‐‐‐‐‐‐‐‐‐‐‐‐‐‐‐‐‐‐‐‐‐‐‐‐‐‐‐‐‐‐‐‐‐‐‐‐‐ Affluent/Advantaged ‐‐‐‐‐>
Average Achievement (Grade Levels)
Academic Achievement and Socioeconomic Status, by Race/Ethnicity
Overall District Socioeoconomic Status
One reason for the large racial/ethnic disparities in achievement may be that even among those
who live in districts with similar socioeconomic conditions, black and Hispanic students are poorer, on
9
average, than white students (see Table 2 above). Figure 4 presents the same sample of districts as Figure
3, but now each race/ethnic group is placed horizontally in relation to its own group’s average
socioeconomic status within the district. Black students have, on average, lower levels of SES than
Hispanic students, who in turn have lower SES than white students. Figure 4 shows that these differences
explain some, but not all of the differences in academic achievement between white and non‐white
students. Even in school districts where black students have relatively high SES, they score far below
(more than a grade level below) white students in districts where white students the same socioeconomic
status. Clearly racial differences in socioeconomic context and conditions are part of the reason for black
and Hispanic students’ lower achievement than white students, but they are not the whole reason.
Figure 4
US School Districts With 100+ Students of a Given Race/Ethnicity, 2009‐2013
4
3
2
1
0
‐1
‐2
White Students
Hispanic Students
Black Students
‐3
‐4
‐5
‐5
‐4
‐3
‐2
‐1
0
1
2
3
<‐‐‐‐‐ Poor/Disadvantaged ‐‐‐‐‐‐‐‐‐‐‐‐‐‐‐‐‐‐‐‐‐‐‐‐‐‐‐‐‐‐‐‐‐‐‐‐‐‐‐‐‐‐‐‐‐‐‐‐‐‐ Affluent/Advantaged ‐‐‐‐‐>
Average Achievement (Grade Levels)
Academic Achievement and Socioeconomic Status, by Race/Ethnicity
Race‐Specific District Socioeoconomic Status
Growth in Academic Performance Across Grades
10
The SEDA data include at least one year of test scores for 10 cohorts of students, those who
entered kindergarten from Fall 2000 through Fall 2009 (the earliest of these cohorts would be expected
to be in 8th grade in 2009, the first year of the SEDA data; the latest of these would be expected to be in
3rd grade in 2013, the last year of the SEDA data). Most of these cohorts are observed for 2 or more years,
so we can estimate the average change in test scores, within cohorts. These estimates are plotted in
Figure 5 in relation to socioeconomic status.
Notable here is the SES‐growth rate gradient. Average test scores grow moderately faster in
higher‐SES school districts than in low‐SES districts. The slope of the fitted line is about 0.04, meaning
that districts that differ by 1 standard deviation in SES differ by about 4% in the annual growth rate of
their students’ performance. This means that students in the most affluent school districts gain almost 1
year more of academic performance growth between third and eighth grade than do the poorest school
districts.
Figure 5
Academic Achievement Growth and Socioeconomic Status
1.50
1.25
1.00
0.75
0.50
‐4
‐3
‐2
‐1
0
1
2
Average Growth (Grades/Year)
100 Largest US School Districts, 2009‐2013
3
<‐‐‐‐‐ Poor/Disadvantaged ‐‐‐‐‐‐‐‐‐‐‐‐‐‐‐‐‐‐‐ Affluent/Advantaged ‐‐‐‐‐>
11
This means that performance disparity between high‐ and low‐SES districts is larger in 8th grade than in 3rd
grade. Figure 6 displays this; it shows the fitted regression line of the association between school district
average test scores and SES for each grade from 3‐8. The line is roughly 20% steeper by 8th grade.
District SES‐Achievement Gradient, by Grade
5
4
3
2
1
0
‐1
‐2
Grade 3
Grade 6
Grade 4
Grade 7
Grade 5
Grade 8
‐3
‐4
‐5
‐4
‐3
‐2
‐1
0
1
2
3
Average Achievement (Grade Levels)
US School Districts, 2009‐2013
<‐‐‐‐‐ Poor/Disadvantaged ‐‐‐‐‐‐‐‐‐‐‐‐‐‐‐‐‐‐‐ Affluent/Advantaged ‐‐‐‐‐>
Conclusion
The data here provide a look, unprecedented in detail, at the patterns of academic achievement
across school districts in the U.S. They show several key things:
1. The variation in academic achievement among school districts is very large; students in some
districts have scores more than 4 grade levels higher than others.
2. This variation is very highly correlated with the socioeconomic characteristics of families in the
local community. It is not clear, however, how much of the association is due to differences in the
quality of schooling, or in the opportunities children have to learn and develop outside of school,
in their homes and neighborhoods.
12
3. The association between community socioeconomic status and academic performance grows
steeper as children progress through school. Again, it is not clear whether this results from
differences in the quality of schools in high‐ and low‐income communities, or because of
differences in children’s outside of school opportunities to learn.
4. Racial/ethnic disparities in academic performance are large, both overall and within individual
school districts. The average within‐district white‐black and white‐Hispanic achievement gaps are
roughly 2.0 and 1.5 grade levels, respectively. Moreover, extremely few black and Hispanic
students live in school districts where average achievement is at the national average for grade
level.
5. Part of the within‐district racial achievement gaps are the result of racial/ethnic disparities in
family socioeconomic background. But even in places where white and black or white and
Hispanic students come from families with the same socioeconomic characteristics, racial/ethnic
achievement gaps are present, and substantial.
Together, these findings suggest that socioeconomic context is a powerful force shaping
children’s educational opportunities and success. But poverty is not destiny; inequality is not inevitable.
There are places where children of a given socioeconomic background perform much better on tests than
children in other places with the same background. It is essential that we learn from such places so that
we can improve educational opportunities for children who do not have the opportunity to grow up in an
affluent community.
13
Download School District Socioeconomic Status, Race, and Academic Achievement
School District Socioeconomic Status, Race, and Academic Achievement.pdf (PDF, 749.38 KB)
Download PDF
Share this file on social networks
Link to this page
Permanent link
Use the permanent link to the download page to share your document on Facebook, Twitter, LinkedIn, or directly with a contact by e-Mail, Messenger, Whatsapp, Line..
Short link
Use the short link to share your document on Twitter or by text message (SMS)
HTML Code
Copy the following HTML code to share your document on a Website or Blog
QR Code to this page

This file has been shared publicly by a user of PDF Archive.
Document ID: 0001934382.