Starbucks race conversation (PDF)
File information
This PDF 1.4 document has been generated by Adobe InDesign CS5 (7.0) / Adobe PDF Library 9.9, and has been sent on pdf-archive.com on 20/03/2015 at 13:13, from IP address 50.141.x.x.
The current document download page has been viewed 364 times.
File size: 583.11 KB (2 pages).
Privacy: public file
File preview
Images and logos on this flyer are used Under Section 107 of the Copyright Act 1976, allowance is
made for “fair use” for purposes such as criticism, comment, news reporting, teaching, scholarship,
and research. Fair use is a use permitted by copyright statute that might otherwise be infringing.
Non-profit, educational or personal use tips the balance in favor of fair use. Use of these works does
not suggests that the respective authors endorse us or our use of the work.
LET’S
START
THE
COVERSATION
ON
RACE
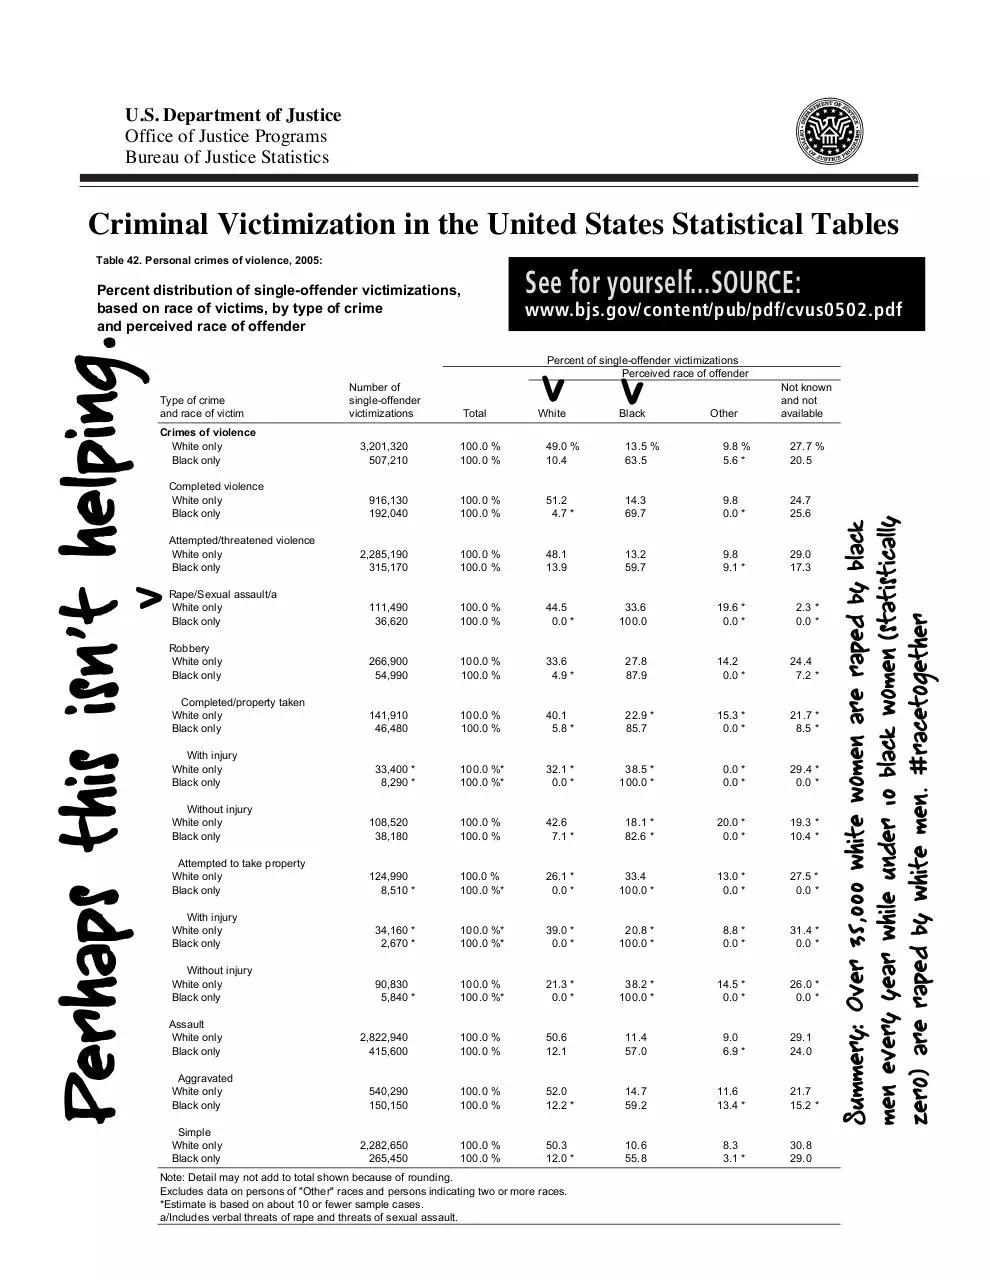
U.S. Department of Justice
Office of Justice Programs
Bureau of Justice Statistics
Criminal Victimization in the United States Statistical Tables
Table 42. Personal crimes of violence, 2005:
See for yourself...SOURCE:
Percent distribution of single-offender victimizations,
based on race of victims, by type of crime
and perceived race of offender
Crimes of violence
White only
Black only
Number of
single-offender
victimizations
Percent of single-offender victimizations
Perceived race of offender
>
Type of crime
and race of victim
www.bjs.gov/content/pub/pdf/cvus0502.pdf
Total
White
Black
Other
Not known
and not
available
3,201,320
507,210
100.0 %
100.0 %
49.0 %
10.4
13.5 %
63.5
9.8 %
5.6 *
27.7 %
20.5
916,130
192,040
100.0 %
100.0 %
51.2
4.7 *
14.3
69.7
9.8
0.0 *
24.7
25.6
2,285,190
315,170
100.0 %
100.0 %
48.1
13.9
13.2
59.7
9.8
9.1 *
29.0
17.3
Rape/Sexual assault/a
White only
Black only
111,490
36,620
100.0 %
100.0 %
44.5
0.0 *
33.6
100.0
19.6 *
0.0 *
2.3 *
0.0 *
Robbery
White only
Black only
266,900
54,990
100.0 %
100.0 %
33.6
4.9 *
27.8
87.9
14.2
0.0 *
24.4
7.2 *
Completed/property taken
White only
Black only
141,910
46,480
100.0 %
100.0 %
40.1
5.8 *
22.9 *
85.7
15.3 *
0.0 *
21.7 *
8.5 *
100.0 %*
100.0 %*
32.1 *
0.0 *
38.5 *
100.0 *
0.0 *
0.0 *
29.4 *
0.0 *
Completed violence
White only
Black only
Attempted/threatened violence
White only
Black only
With injury
White only
Black only
33,400 *
8,290 *
Without injury
White only
Black only
108,520
38,180
100.0 %
100.0 %
42.6
7.1 *
18.1 *
82.6 *
20.0 *
0.0 *
19.3 *
10.4 *
Attempted to take property
White only
Black only
124,990
8,510 *
100.0 %
100.0 %*
26.1 *
0.0 *
33.4
100.0 *
13.0 *
0.0 *
27.5 *
0.0 *
With injury
White only
Black only
34,160 *
2,670 *
100.0 %*
100.0 %*
39.0 *
0.0 *
20.8 *
100.0 *
8.8 *
0.0 *
31.4 *
0.0 *
Without injury
White only
Black only
90,830
5,840 *
100.0 %
100.0 %*
21.3 *
0.0 *
38.2 *
100.0 *
14.5 *
0.0 *
26.0 *
0.0 *
2,822,940
415,600
100.0 %
100.0 %
50.6
12.1
11.4
57.0
9.0
6.9 *
540,290
150,150
100.0 %
100.0 %
52.0
12.2 *
14.7
59.2
11.6
13.4 *
2,282,650
265,450
100.0 %
100.0 %
50.3
12.0 *
10.6
55.8
8.3
3.1 *
Assault
White only
Black only
Aggravated
White only
Black only
Simple
White only
Black only
Note: Detail may not add to total shown because of rounding.
Excludes data on persons of "Other" races and persons indicating two or more races.
*Estimate is based on about 10 or fewer sample cases.
a/Includes verbal threats of rape and threats of sexual assault.
29.1
24.0
21.7
15.2 *
30.8
29.0
Download Starbucks race conversation
Starbucks_race_conversation.pdf (PDF, 583.11 KB)
Download PDF
Share this file on social networks
Link to this page
Permanent link
Use the permanent link to the download page to share your document on Facebook, Twitter, LinkedIn, or directly with a contact by e-Mail, Messenger, Whatsapp, Line..
Short link
Use the short link to share your document on Twitter or by text message (SMS)
HTML Code
Copy the following HTML code to share your document on a Website or Blog
QR Code to this page

This file has been shared publicly by a user of PDF Archive.
Document ID: 0000216297.