INFOGRAPHIC (PDF)
File information
Title: Web
This PDF 1.3 document has been generated by Adobe Illustrator CS6 (Macintosh) / Mac OS X 10.7.5 Quartz PDFContext, and has been sent on pdf-archive.com on 02/02/2016 at 23:45, from IP address 198.102.x.x.
The current document download page has been viewed 431 times.
File size: 737 KB (1 page).
Privacy: public file
File preview
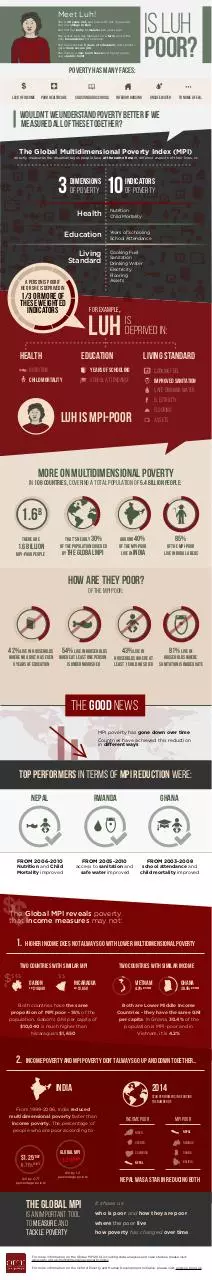
IS LUH
POOR?
Meet Luh!
She is 28 years old, and lives with her 7-year-old
son in a village in Bali
She lost her baby to malaria two years ago
She works as a day labourer on a farm, and is the
only breadwinner in the family
She has less than 5 years of education, and cannot
get a more secure job
She lives in a one-room house and has to pay to
use a public toilet
Poverty has many faces:
poor healthcare
lack of income
Substandard schools
unsafe water
Inferior housing
to name a few…
Wouldn’t we understand poverty better if we
measured all of these together?
The Global Multidimensional Poverty Index (MPI)
directly measures the disadvantages people face at the same time in different aspects of their lives, in:
3
Dimensions
of POVERTY
10
Health
Education
Living
Standard
A person is poor if
He or she is deprived in
1/3 or more of
these weighted
indicators
INDICATORS
of POVERTY
Nutrition
Child Mortality
Years of Schooling
School Attendance
Cooking Fuel
Sanitation
Drinking Water
Electricity
Flooring
Assets
for example,
LUH
Health
is
deprived in:
Living Standard
Education
Nutrition
Years of Schooling
Cooking Fuel
Child Mortality
School Attendance
Improved Sanitation
Safe Drinking Water
Electricity
Flooring
LUH is MPI-POOR
Assets
More on Multidimensional poverty
In 108 countries, covering a total population of 5.4 billion people:
1.6
B
There are
1.6 billion
MPI-poor people
THAT’s nearly 30%
of the population covered
by the Global MPI
85%
AROUND 40%
of the MPI-poor
live in India
of the MPI-poor
live in rural AREAS
How are they poor?
Of the MPI poor:
42% live in households
54% live in households
43% live in
81% live in
where no adult has even
5 years of education
where at least one person
is undernourished
households where at
least 1 child has died
households where
sanitation is inadequate
THE GOOD NEWS
MPI poverty has gone down over time
Countries have achieved this reduction
in different ways
top performers in terms of MPI reduction were:
NEPAL
RWANDA
GHANA
FROM 2006-2010
FROM 2005-2010
FROM 2003-2008
Nutrition and Child
Mortality improved
access to sanitation and
safe water improved
school attendance and
child mortality improved
The Global MPI reveals poverty
that income measures may not:
1. Higher income does not always go with lower multidimensional poverty
Two countries with similar MPI
$
$
$ $$
Two countries with similar INCOME
$$
GABON
GNI
NICARAGUA
$10,040
GNI
$1,650
Both countries have the same
proportion of MPI poor - 16% of the
population. Gabon's GNI per capita of
$10,040 is much higher than
Nicaragua's $1,650
2.
VIETNAM
Ghana
4.2% MPI-poor
30.4% MPI-poor
Both are Lower Middle Income
Countries - they have the same GNI
per capita. In Ghana, 30.4% of the
population is MPI-poor and in
Vietnam, it is 4.2%
Income poverty and MPI poverty don’t always go up and down together…
INDIA
2014
Star Performers in reducing
The number of:
From 1999-2006, India reduced
multidimensional poverty faster than
income poverty. The percentage of
people who are poor according to
$1.25
/day
-0.71%POINtS
fell by 0.71
percentage points
INCOME POOR
MPI POOR
NIGER
NEPAL
UGANDA
RWANDA
Global MPI
CAMBODIA
GHANA
-1.2 % Points
NEPAL
BOLIVIA
fell by 1.2
percentage points
THE GLOBAL MPI
IS AN IMPORTANT TOOL
TO MEASURE AND
TACKLE POVERTY
Nepal was a star in reducing both
It shows us
who is poor and how they are poor
where the poor live
how poverty has changed over time
For more information on the Global MPI 2014, including data, analyses and case studies, please visit:
www.ophi.org.uk/multidimensional-poverty-index
For more information on the Oxford Poverty and Human Development Initiative, please visit: www.ophi.org.uk
Download INFOGRAPHIC
INFOGRAPHIC.pdf (PDF, 737 KB)
Download PDF
Share this file on social networks
Link to this page
Permanent link
Use the permanent link to the download page to share your document on Facebook, Twitter, LinkedIn, or directly with a contact by e-Mail, Messenger, Whatsapp, Line..
Short link
Use the short link to share your document on Twitter or by text message (SMS)
HTML Code
Copy the following HTML code to share your document on a Website or Blog
QR Code to this page

This file has been shared publicly by a user of PDF Archive.
Document ID: 0000337166.