Appendix (PDF)
File information
This PDF 1.5 document has been generated by / Skia/PDF m55, and has been sent on pdf-archive.com on 28/10/2016 at 07:09, from IP address 76.103.x.x.
The current document download page has been viewed 569 times.
File size: 1.81 MB (56 pages).
Privacy: public file


File preview
“There is no reason to trust insiders in the elections industry.” - Jimmy Carter
August 8th update: More reports from various states will soon be uploaded here, along
with the data. As of now, we have responded at length to our critics here. Please note that this
is a living document (more data becomes available to us every day.) We appreciate those
readers who are now inspecting their own countries. Please let us know if you need any
additional help with your efforts. In regards to peer review, we will seek publication in an
academic journal at a later time. Rather than keeping the information to ourselves, we wanted
people to engage with the data. Please contact us if you have any questions or suggestions:
a.geijsel@tilburguniversity.edu, cortes@stanford.edu. If you are able to help us in our effort,
please visit our GoFundMe. Thank you.
Following our main initial report, here are the main take-aways from our extensive investigation:
1. Clinton overperformed the polls only in states that are vulnerable to electronic hacking.
2. Clinton’s strong performance can be traced to strong performance with
African-Americans, but that doesn’t tell the full story: Even when we adjust for this
alternative explanation in all sorts of ways, Clinton still performed better in states that are
most vulnerable to electronic hacking (to reduce overfitting and multicollinearity we
suggest trying models that merge Latinos/Asians and dropping European-Americans
who are indirectly represented in resulting models.)
a. Download data on Clinton’s popular vote %, Census 2010 ethnic breakdowns by
state, and paper/no paper trail.
3. Exit polls were particularly “off” in states that were most vulnerable to electronic hacking.
4. Clinton’s performance boost in these types of states did not occur in 2008 (Obama did
not benefit either.)
5. It is easy to do a close inspection of some states, such as Louisiana. All of the machines
in use in Louisiana are the AVC Advantage machines, which Princeton Computer
Science Professor Andrew Appel describes as hackable. O
ur close analysis of Louisiana
revealed anomalies that favored Clinton in 85% of the counties. The Republicans did
seem not benefit from the statistical anomaly in any of the counties.
a. Download Republican data: Note the flatness of the curves (results in smaller
precincts are similar to results in larger precincts)
b. Download Democratic data: Note the steepness of the curves (results in larger
precincts tend to favor Clinton).
c. Note that according to p
olls, Clinton was expected to get around 60%. The official
result showed her at 71%.
d. This doesn’t seem to reflect racial factors (the pattern shows up heavily White
counties and in heavily African-American counties), and it doesn’t reflect urban
vs. rural divide since large cities can often have small precincts and small towns
can often have big precincts
e. Potential explanation: One theory that o
thers have advanced for this is that, if
anyone were to attempt to hack electronic voting machines, they may choose to
do it in larger precincts (lots of votes.) Overall, one would expect that, within the
same geographical area (a county), the vote should be similar at larger and
smaller precincts. However, this principle is violated for larger precincts only in
the Democratic race.
6. Two of the three main voting machine companies (Dominion Voting and Hart Intercivic,
through H.I.G. Capital) are donors to the Clinton Foundation [Check Guccifer 2.0’s
spreadsheet.] This brings up issues of private companies being involved in public
elections. It does NOT mean the companies hacked the vote. Anyone with
knowledge and access could potentially influence the machines (see report from
Professor Appel.)
We will have more to say about the rest of the states soon (we will show data at the level of
detail that we did for Louisiana.) Other states do not provide their data in as user-friendly form
as Louisiana.
Note that the WashPo has become interested in the idea that Russia could hack our elections
Obama administration grows concerned regarding the possibility of hacked voting machines
Politico story on the issue
Analysis of polls of likely voters:
The following analysis examines discrepancies in polls of likely voters once compared to the
official results. These data are available on Real Clear Politics. We will upload them onto this
document very soon.
The benefit of this kind of analysis is that it sidesteps the controversy around exit polls. These
pre-election polls of likely voters cover almost all the primary states. There 337 polls listed by
Real Clear Politics represent 139,231 voters across 34 primary states.
We found that while the polls were quite successful at predicting Clinton’s numbers in states
with paper trails (just a statistically inconsequential 1% difference), Clinton over-performed by an
average of 9% in the states that use electronic voting machines but fail to provide paper
evidence of this vote:
Thus, pollsters were quite accurate in predicting the outcome, but only in states where fraud is
hardest to hide. This situation is completely flipped in the states where the placed vote cannot
be verified, as the vote only ever existed in the machines.
Louisiana example
It is quite possible that the vote in these states was, in fact, manipulated. Studies conducted by
teams of computer scientists at Princeton, NYU, and UCSD show that the machines from all
major companies, such as the AVC Advantage made by Sequoia (now owned by Dominion),
have severe security issues and are very vulnerable to network viruses. Despite this fact, there
is very little state or federal regulation of the machines, and regulations regarding intellectual
property have often prevented independent research.
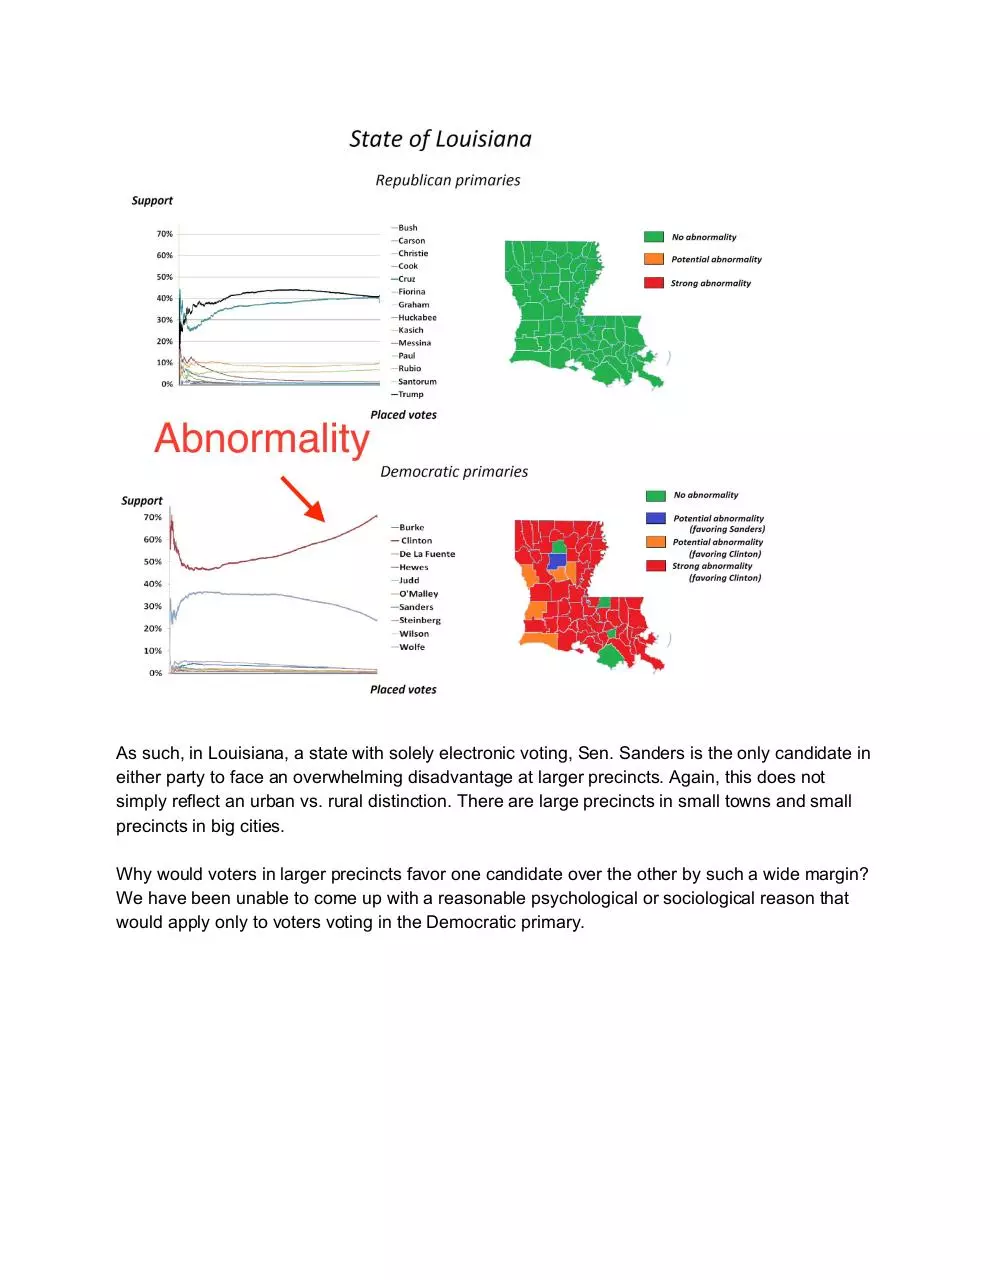
As described above, Louisiana uses the hackable AVC Advantage machine. When we looked at
the results of the Republican primaries, we did not observe that any candidate kept gaining a
larger and larger share of the vote at larger precincts (meaning the lines were relatively stable
as precinct size increased). However, when we looked at the Democratic primaries, we
observed severe abnormalities. Namely, the share of votes that Hillary Clinton received kept
increasing (leading to a whopping 25%). This type of statistical abnormality is seen in almost
every parish (county). It does not appear in any parish for the Republican primary:
As such, in Louisiana, a state with solely electronic voting, Sen. Sanders is the only candidate in
either party to face an overwhelming disadvantage at larger precincts. Again, this does not
simply reflect an urban vs. rural distinction. There are large precincts in small towns and small
precincts in big cities.
Why would voters in larger precincts favor one candidate over the other by such a wide margin?
We have been unable to come up with a reasonable psychological or sociological reason that
would apply only to voters voting in the Democratic primary.
Graspable state-by-state comparisons
One of our readers, C. F., requested a more intuitive version of the analysis whereby we
“adjust” for explanations such as ethnicity and political ideology: A side-by-side comparisons of
states. Not only is this a great way to identify pairs of states that are similar, but which differ in
their level of electoral fraud risk, it really gets at the key concept behind the idea of “adjusting”
for different factors.
Thus: All of the following pairs of states are highly similar in terms of the percent of
African-Americans and the percent of liberals (which is a concept measured by Gallup in 2015”).
As such, a key difference within the following pairs of states is that they differ on their level of
risk for electoral fraud and, as expected, also on their level of support for Secretary Clinton.
Similar “Blue” States: Illinois (mild risk) and New Jersey (high risk)
Illinois and New Jersey are two of the most populous states in the country.
Homeownership rates are similar across both states, as is the percentage of
African-American-owned businesses. Indeed, both states have roughly the same percentage of
African-Americans, and the same percentage of liberals. Both have the same level of income
inequality. However, while New Jersey is at high risk of electoral fraud, Illinois is only at mild
risk. Interestingly, Secretary Clinton won Illinois at 51%, but trounced Senator Sanders in New
Jersey with 63%.
Similar “Red” States: Oklahoma (low risk) and Kentucky (high risk)
Oklahoma and Kentucky are both mid-sized, landlocked Southern states. They do not
receive much attention on the national stage. The percentage of African-Americans and of
liberals across the two states is very close. Yet, while Oklahoma is at low risk of electoral fraud,
Kentucky is at high risk. Secretary Clinton did about 5% better in Kentucky than in Oklahoma.
Similar Midwest States: Michigan (low risk) and Ohio (mild risk)
Michigan and Ohio are both major Midwestern states. They are both often described as
the “heartland” of America. In the wake of once bustling economies, people in both states have
felt squeezed as traditional manufacturing jobs have evaporated over the past decades.
Politically, the percentage of people who identify as liberals is very similar across the two states,
and the percentage of African-Americans is almost identical. Yet, while Michigan is at low risk of
electoral fraud, Ohio is at mild risk. As our core idea would predict, Secretary Clinton did better
in Ohio than in Michigan: 8 points better.
Similar Mountain States: New Mexico (low risk) and Arizona (mild risk)
While Arizona is more populous than New Mexico, the states are both in the Mountain
region, occupy similar amounts of land, border one another, have a high percentage of
Hispanics/Latinos (compared to most other states), have similar incomes per capita, and similar
levels of poverty. Both states have a small percentage of African-American voters and about
25% of their populations identify as liberal. However, electoral fraud is more difficult in New
Mexico than it is in Arizona (which has officially admitted electoral fraud). Intriguingly, Secretary
Clinton did about 3% better in Arizona than in highly similar New Mexico.
Similar Atlantic States: North Carolina (mild risk) and Virginia (high risk)
North Carolina and Virginia are “sibling” states. They border one another, have a healthy
rivalry, and are both situated in the the middle of the East Coast. The population in each state is
about 20% African-American and 20% liberal. Firms owned by African-Americans are around
10% in each state. Both states hold around 200 people per square mile. However, while North
Carolina is only at mild risk of election fraud, Virginia is at high risk. Intriguingly, Secretary
Clinton’s edge in Virginia was perhaps around 12% higher than her win in North Carolina.
Thus, state-by-state comparisons from different regions of the country illustrate what it
means to adjust for an alternative explanation: It means to find similar states in the dataset and
looking for the differences in the explanation under scrutiny (in this case: states at risk of
electoral fraud.) When we carry out this analysis, it appears as if Secretary Clinton does better
in states wherein the risk of electoral fraud is at high.
Similar “Blue”
States
Similar “Red”
States
Similar
Midwest
% AfricanAmericans
%
Liberals
% Clinton
Popular Vote
in Official
Result
% Clinton
Delegates
Risk of
electoral
fraud
Illinois
15
26
51
51
Mild (some
hackable
machines)
New
Jersey
14
26
63
63
High (very
hackable
machines)
Oklahoma
7
17
41
44
Low
(paper
ballot)
Kentucky
8
19
47
50
High
Michigan
14
23
48
48
Low
Similar
Mountain
States
Similar
Atlantic
States
Ohio
12
20
56
56
Mild
New
Mexico
2
26
51
52
Low
Arizona
4
22
56
56
Mild
N.
Carolina
22
20
54
56
Mild
Virginia
20
22
64
65
High
Addressing the role of race/ethnicity when treating % delegates as the
outcome
In regards to the core data, we have been criticized for how we conducted our analysis
of alternative explanations. Specifically, many readers criticized us for focusing on non-Hispanic
Whites, rather than African-Americans. Indeed, African-American have long been strong
supporters of Secretary Clinton as well as former President Clinton. As such, here, we focused
on the percentage of African-Americans living in the state (as measured by the latest Census in
2010). We did not focus on the percentage of African-American Democratic voters because a lot
of primaries are open to non-Democrats. We know of no publically accessible data that would
allow us to account for the ethnic/racial composition of the people who actually voted using a
Democratic ballot. Thus, we must settle for general statewide measures of the percentage of
African-Americans.
First off, as should be expected, the data validate two obvious aspects of the e
lectoral
map: The the greater the percentage of African-Americans, the more support for Secretary
Clinton. And, the more Democratic the state, the less support for Secretary Clinton. Indeed,
Clinton swept the South (which has the highest proportion of African-Americans) while Sanders
swept the nation’s most solidly White and Democratic states (e.g., Vermont, Oregon,
Minnesota).
But now comes the most important point: Once we adjust for the role of
African-Americans and political ideology, does the risk of electoral fraud continue to play a role
in explaining support for Secretary Clinton? One important aspect which we failed to touch in
our initial analysis is to check and correct for outliers ( data points far from the average). Outliers
are known to exert undue influence within small datasets such as ours (we only have 36 states
with primaries).
Thus, we checked to see whether a formal analysis “ Cook’s distance”, would suggest
that we must exclude any outlier states when attempting to correct for alternative explanations.
Indeed, the analysis found that Alabama and Vermont were exercising an abnormally high
influence on the process of “adjusting” for different explanations. In other words, if we didn’t
exclude these states, the results would probably be inaccurate. Thus, based on our findings
after applying "Cook's distance" we dropped Alabama and Vermont from the analysis.
When we do this, we are essentially cleaning up our data, to make it easier to analyze
and more reliable. So, what do we find? The numbers show that e
ven when adjusting for the
percentage of African-Americans in the state and the role of political ideology, as the risk of
electoral fraud increases, so too does the claimed level of support for Secretary Clinton.
Some critics will now ask, why didn’t we adjust for all the other ethnicities? Unfortunately,
there are only 36 states in the primaries, and when doing this kind of analysis it is often
recommended that each alternative explanation have at least 10 data points (i.e., states.) As
such, we are necessarily limited. However, interested readers will note that we tried out many
exploratory models. In a nutshell, we found that our risk variable seemed robust to alternative
explanations, including age, gender, other races/ethnicities, urbanization (i.e. rural-city),
population density, Southern/non-Southern states, election performance, and even personality
differences between states. Specifics:
Download Appendix
Appendix.pdf (PDF, 1.81 MB)
Download PDF
Share this file on social networks
Link to this page
Permanent link
Use the permanent link to the download page to share your document on Facebook, Twitter, LinkedIn, or directly with a contact by e-Mail, Messenger, Whatsapp, Line..
Short link
Use the short link to share your document on Twitter or by text message (SMS)
HTML Code
Copy the following HTML code to share your document on a Website or Blog
QR Code to this page

This file has been shared publicly by a user of PDF Archive.
Document ID: 0000500879.