Portfolio (PDF)
File information
Title: Quant Analyzer Portfolio Report
This PDF 1.4 document has been generated by PD4ML. HTML to PDF Converter for Java (398fx2), and has been sent on pdf-archive.com on 21/11/2016 at 16:12, from IP address 94.242.x.x.
The current document download page has been viewed 321 times.
File size: 1.13 MB (2 pages).
Privacy: public file
File preview
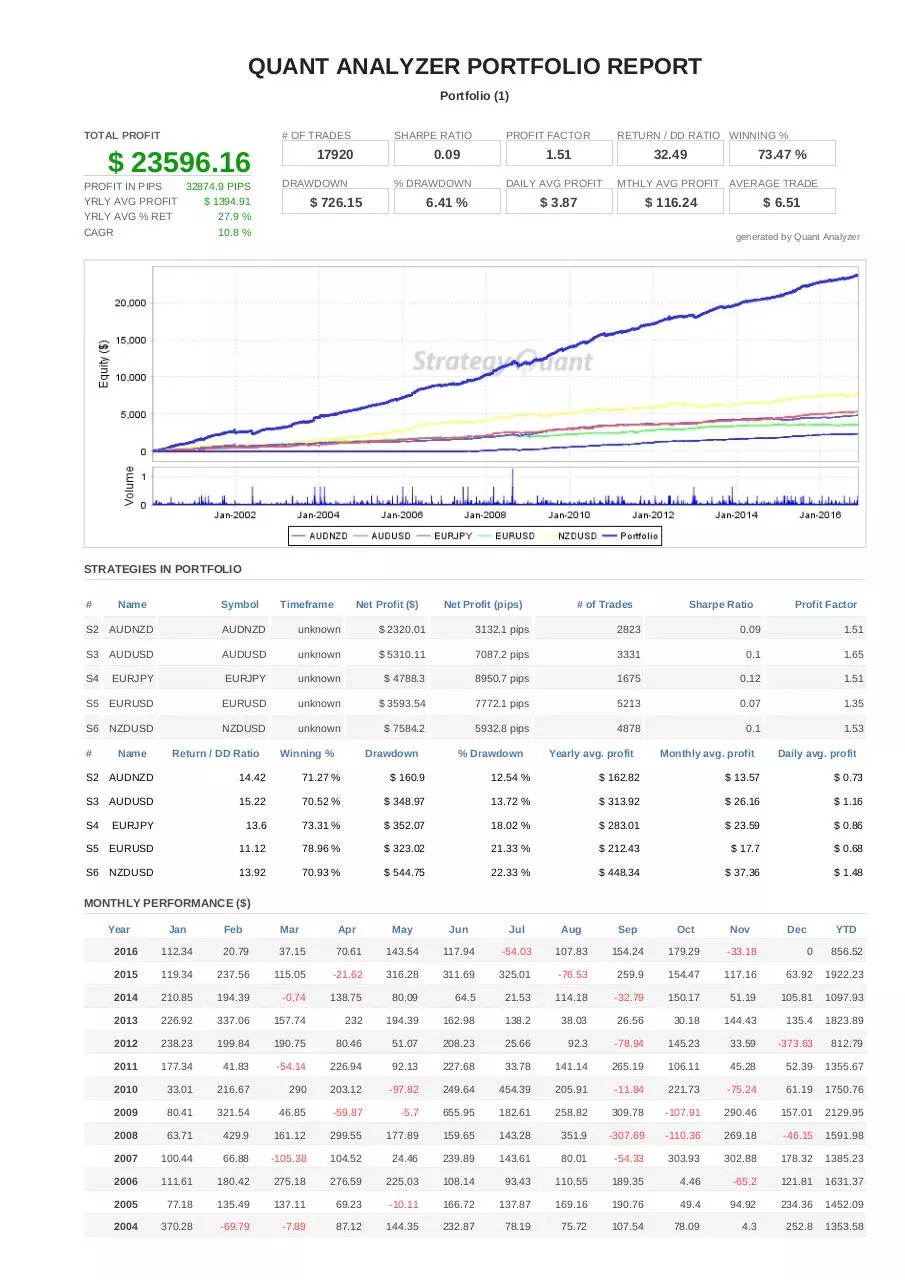
QUANT ANALYZER PORTFOLIO REPORT
Portfolio (1)
TOTAL PROFIT
# OF TRADES
17920
$ 23596.16
PROFIT IN PIPS
32874.9 PIPS
YRLY AVG PROFIT
$ 1394.91
YRLY AVG % RET
27.9 %
CAGR
10.8 %
SHARPE RATIO
PROFIT FACTOR
0.09
DRAWDOWN
1.51
% DRAWDOWN
$ 726.15
RETURN / DD RATIO WINNING %
32.49
DAILY AVG PROFIT
6.41 %
73.47 %
MTHLY AVG PROFIT AVERAGE TRADE
$ 3.87
$ 116.24
$ 6.51
generated by Quant Analyzer
STRATEGIES IN PORTFOLIO
#
Name
Symbol
Timeframe
Net Profit ($)
Net Profit (pips)
# of Trades
Sharpe Ratio
Profit Factor
S2
AUDNZD
AUDNZD
unknown
$ 2320.01
3132.1 pips
2823
0.09
1.51
S3
AUDUSD
AUDUSD
unknown
$ 5310.11
7087.2 pips
3331
0.1
1.65
S4
EURJPY
EURJPY
unknown
$ 4788.3
8950.7 pips
1675
0.12
1.51
S5
EURUSD
EURUSD
unknown
$ 3593.54
7772.1 pips
5213
0.07
1.35
S6
NZDUSD
NZDUSD
unknown
$ 7584.2
5932.8 pips
4878
0.1
1.53
#
Name
Return / DD Ratio
Winning %
Drawdown
% Drawdown
Yearly avg. profit
Monthly avg. profit
Daily avg. profit
S2
AUDNZD
14.42
71.27 %
$ 160.9
12.54 %
$ 162.82
$ 13.57
$ 0.73
S3
AUDUSD
15.22
70.52 %
$ 348.97
13.72 %
$ 313.92
$ 26.16
$ 1.16
S4
EURJPY
13.6
73.31 %
$ 352.07
18.02 %
$ 283.01
$ 23.59
$ 0.86
S5
EURUSD
11.12
78.96 %
$ 323.02
21.33 %
$ 212.43
$ 17.7
$ 0.68
S6
NZDUSD
13.92
70.93 %
$ 544.75
22.33 %
$ 448.34
$ 37.36
$ 1.48
MONTHLY PERFORMANCE ($)
Year
Jan
Feb
Mar
Apr
May
Jun
Jul
Aug
Sep
Oct
Nov
Dec
YTD
2016
112.34
20.79
37.15
70.61
143.54
117.94
-54.03
107.83
154.24
179.29
-33.18
0
856.52
2015
119.34
237.56
115.05
-21.62
316.28
311.69
325.01
-76.53
259.9
154.47
117.16
63.92
1922.23
2014
210.85
194.39
-0.74
138.75
80.09
64.5
21.53
114.18
-32.79
150.17
51.19
105.81
1097.93
2013
226.92
337.06
157.74
232
194.39
162.98
138.2
38.03
26.56
30.18
144.43
135.4
1823.89
2012
238.23
199.84
190.75
80.46
51.07
208.23
25.66
92.3
-78.94
145.23
33.59
-373.63
812.79
2011
177.34
41.83
-54.14
226.94
92.13
227.68
33.78
141.14
265.19
106.11
45.28
52.39
1355.67
2010
33.01
216.67
290
203.12
-97.82
249.64
454.39
205.91
-11.84
221.73
-75.24
61.19
1750.76
2009
80.41
321.54
46.85
-59.87
-5.7
655.95
182.61
258.82
309.78
-107.91
290.46
157.01
2129.95
2008
63.71
429.9
161.12
299.55
177.89
159.65
143.28
351.9
-307.69
-110.36
269.18
-46.15
1591.98
2007
100.44
66.88
-105.38
104.52
24.46
239.89
143.61
80.01
-54.33
303.93
302.88
178.32
1385.23
2006
111.61
180.42
275.18
276.59
225.03
108.14
93.43
110.55
189.35
4.46
-65.2
121.81
1631.37
2005
77.18
135.49
137.11
69.23
-10.11
166.72
137.87
169.16
190.76
49.4
94.92
234.36
1452.09
2004
370.28
-69.79
-7.89
87.12
144.35
232.87
78.19
75.72
107.54
78.09
4.3
252.8
1353.58
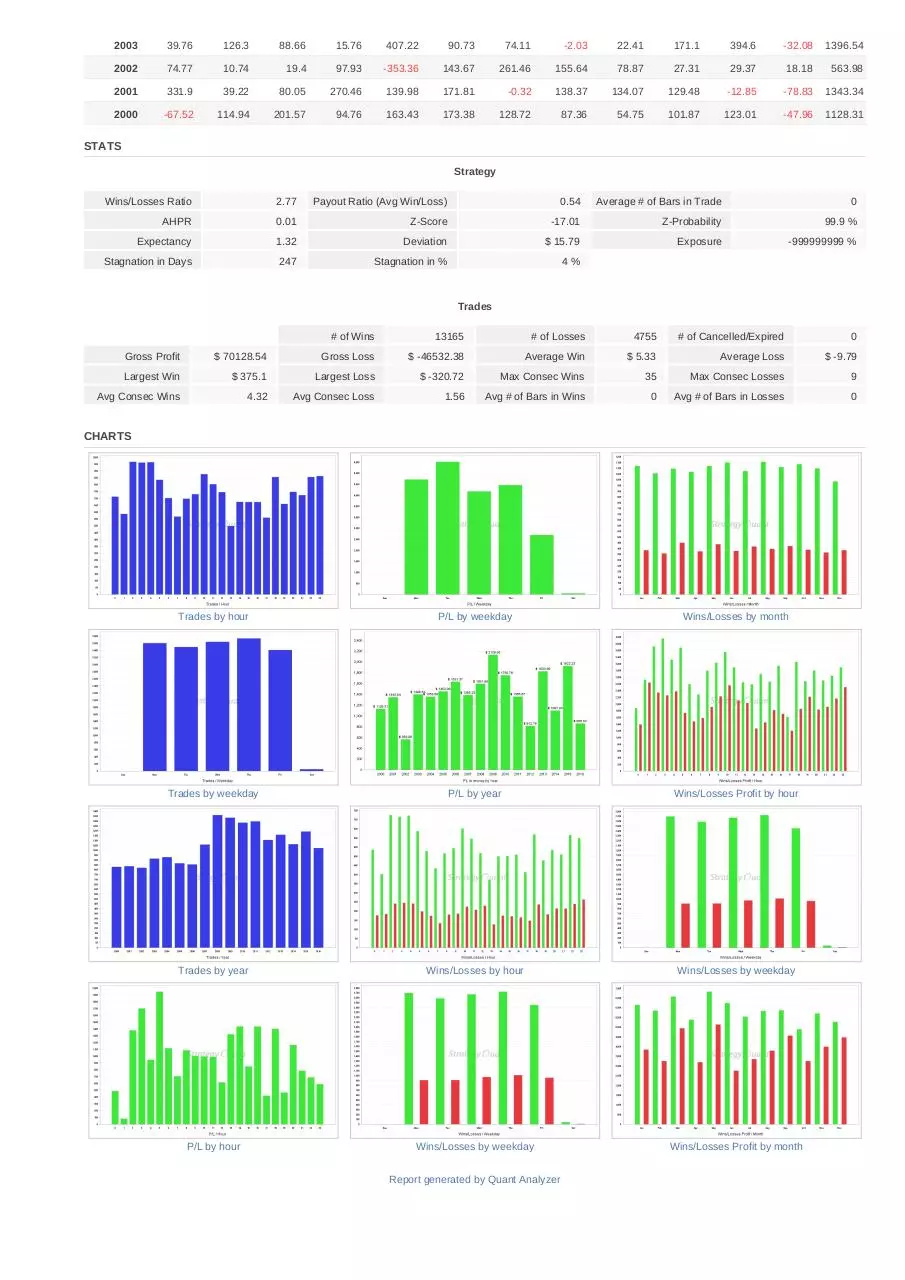
2003
39.76
126.3
88.66
15.76
407.22
90.73
74.11
-2.03
22.41
171.1
394.6
-32.08
1396.54
2002
74.77
10.74
19.4
97.93
-353.36
143.67
261.46
155.64
78.87
27.31
29.37
18.18
563.98
2001
331.9
39.22
80.05
270.46
139.98
171.81
-0.32
138.37
134.07
129.48
-12.85
-78.83
1343.34
2000
-67.52
114.94
201.57
94.76
163.43
173.38
128.72
87.36
54.75
101.87
123.01
-47.96
1128.31
STATS
Strategy
Wins/Losses Ratio
2.77
Payout Ratio (Avg Win/Loss)
0.54
Average # of Bars in Trade
0
AHPR
0.01
Z-Score
-17.01
Z-Probability
99.9 %
Expectancy
1.32
Deviation
$ 15.79
Exposure
-999999999 %
Stagnation in Days
247
Stagnation in %
4%
Trades
# of Wins
13165
# of Losses
4755
# of Cancelled/Expired
0
Gross Profit
$ 70128.54
Gross Loss
$ -46532.38
Average Win
$ 5.33
Average Loss
$ -9.79
Largest Win
$ 375.1
Largest Loss
$ -320.72
Max Consec Wins
35
Max Consec Losses
9
Avg Consec Wins
4.32
Avg Consec Loss
1.56
Avg # of Bars in Wins
0
Avg # of Bars in Losses
0
CHARTS
Trades by hour
P/L by weekday
Wins/Losses by month
Trades by weekday
P/L by year
Wins/Losses Profit by hour
Trades by year
Wins/Losses by hour
Wins/Losses by weekday
P/L by hour
Wins/Losses by weekday
Wins/Losses Profit by month
Report generated by Quant Analyzer
Download Portfolio
Portfolio.pdf (PDF, 1.13 MB)
Download PDF
Share this file on social networks
Link to this page
Permanent link
Use the permanent link to the download page to share your document on Facebook, Twitter, LinkedIn, or directly with a contact by e-Mail, Messenger, Whatsapp, Line..
Short link
Use the short link to share your document on Twitter or by text message (SMS)
HTML Code
Copy the following HTML code to share your document on a Website or Blog
QR Code to this page

This file has been shared publicly by a user of PDF Archive.
Document ID: 0000510634.