Emissions Report (PDF)
File information
Title: Emissions_Report
This PDF 1.3 document has been generated by Microsoft Reporting Services 10.0.0.0 / Microsoft Reporting Services PDF Rendering Extension 10.0.0.0, and has been sent on pdf-archive.com on 08/12/2016 at 20:29, from IP address 131.90.x.x.
The current document download page has been viewed 348 times.
File size: 851.02 KB (27 pages).
Privacy: public file


File preview
Pacific Gas and Electric Corporation
Emissions Year 2014
The Climate Registry
Pacific Gas and Electric
Corporation
Detail Report - Control (Public)
Complete Inventory 2014
Description:
Pacific Gas and Electric Company, incorporated in California in 1905, is one of the largest combination natural gas and electric utilities in the
United States.
Industry:
22 - Utilities
Address:
77 Beale Street
B-28P
San Francisco, California US
Contact:
Britta Victor
bxvu@pge.com
Website: www.pge.com
Reporting Information
Reporting Protocol: General Reporting Protocol 2.0 and associated updates and clarifications
GWP Standard: SAR
Base Year:
Consolidation Methodology: Operational Control Only
Status: TCR Accepted
Verification Information
Verification Body: GHD (formerly Conestoga-Rovers & Associates Limited prior to 2014)
Level of Assurance: Reasonable
Report generated on 12/8/2016 9:45:54
AM
The Climate Registry
Page 1 of 27
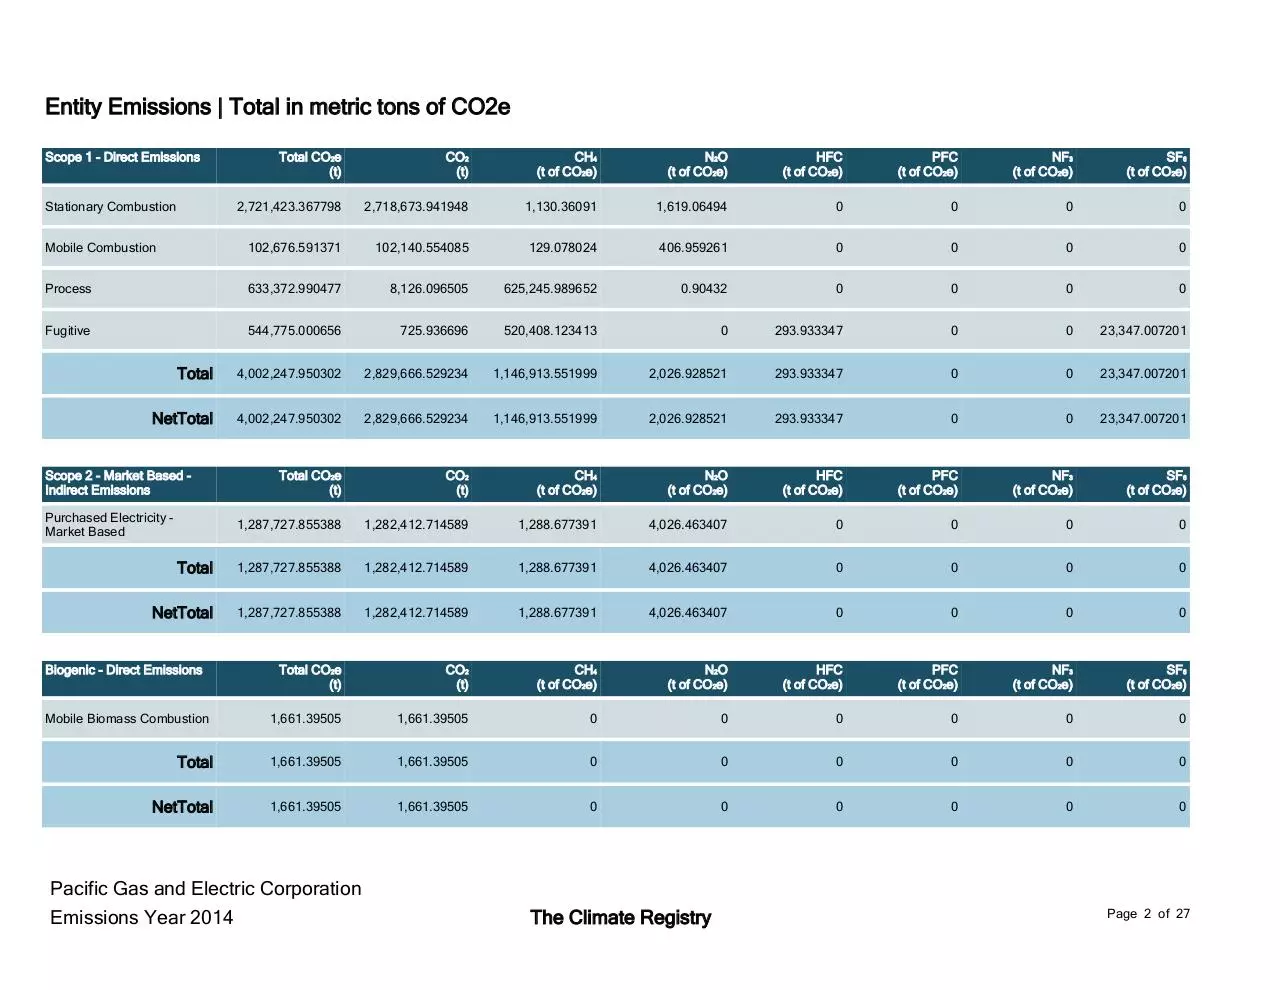
Entity Emissions | Total in metric tons of CO2e
Scope 1 - Direct Emissions
Total CO2e
(t)
CO2
(t)
CH4
(t of CO2e)
N2O
(t of CO2e)
HFC
(t of CO2e)
PFC
(t of CO2e)
NF3
(t of CO2e)
SF6
(t of CO2e)
2,721,423.367798
2,718,673.941948
1,130.36091
1,619.06494
0
0
0
0
Mobile Combustion
102,676.591371
102,140.554085
129.078024
406.959261
0
0
0
0
Process
633,372.990477
8,126.096505
625,245.989652
0.90432
0
0
0
0
Fugitive
544,775.000656
725.936696
520,408.123413
0
293.933347
0
0
23,347.007201
Total
4,002,247.950302
2,829,666.529234
1,146,913.551999
2,026.928521
293.933347
0
0
23,347.007201
NetTotal
4,002,247.950302
2,829,666.529234
1,146,913.551999
2,026.928521
293.933347
0
0
23,347.007201
Total CO2e
(t)
CO2
(t)
CH4
(t of CO2e)
N2O
(t of CO2e)
HFC
(t of CO2e)
PFC
(t of CO2e)
NF3
(t of CO2e)
SF6
(t of CO2e)
1,287,727.855388
1,282,412.714589
1,288.677391
4,026.463407
0
0
0
0
Total
1,287,727.855388
1,282,412.714589
1,288.677391
4,026.463407
0
0
0
0
NetTotal
1,287,727.855388
1,282,412.714589
1,288.677391
4,026.463407
0
0
0
0
Total CO2e
(t)
CO2
(t)
CH4
(t of CO2e)
N2O
(t of CO2e)
HFC
(t of CO2e)
PFC
(t of CO2e)
NF3
(t of CO2e)
SF6
(t of CO2e)
1,661.39505
1,661.39505
0
0
0
0
0
0
Total
1,661.39505
1,661.39505
0
0
0
0
0
0
NetTotal
1,661.39505
1,661.39505
0
0
0
0
0
0
Stationary Combustion
Scope 2 - Market Based Indirect Emissions
Purchased Electricity Market Based
Biogenic - Direct Emissions
Mobile Biomass Combustion
Pacific Gas and Electric Corporation
Emissions Year 2014
The Climate Registry
Page 2 of 27
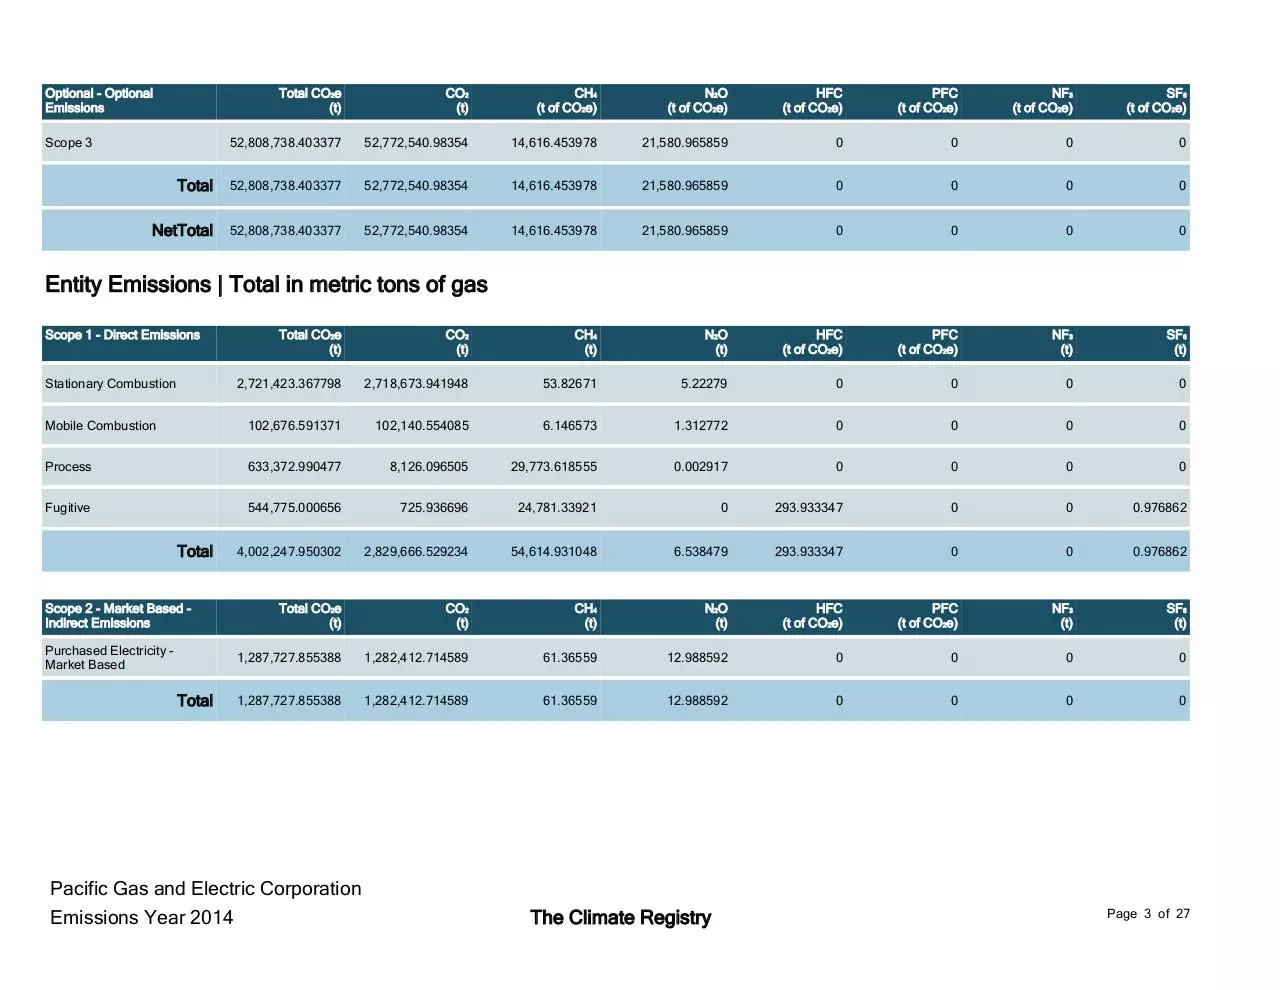
Optional - Optional
Emissions
Total CO2e
(t)
CO2
(t)
CH4
(t of CO2e)
N2O
(t of CO2e)
HFC
(t of CO2e)
PFC
(t of CO2e)
NF3
(t of CO2e)
SF6
(t of CO2e)
52,808,738.403377
52,772,540.98354
14,616.453978
21,580.965859
0
0
0
0
Total
52,808,738.403377
52,772,540.98354
14,616.453978
21,580.965859
0
0
0
0
NetTotal
52,808,738.403377
52,772,540.98354
14,616.453978
21,580.965859
0
0
0
0
Scope 3
Entity Emissions | Total in metric tons of gas
Scope 1 - Direct Emissions
Total CO2e
(t)
CO2
(t)
CH4
(t)
N2O
(t)
HFC
(t of CO2e)
PFC
(t of CO2e)
NF3
(t)
SF6
(t)
2,721,423.367798
2,718,673.941948
53.82671
5.22279
0
0
0
0
Mobile Combustion
102,676.591371
102,140.554085
6.146573
1.312772
0
0
0
0
Process
633,372.990477
8,126.096505
29,773.618555
0.002917
0
0
0
0
Fugitive
544,775.000656
725.936696
24,781.33921
0
293.933347
0
0
0.976862
4,002,247.950302
2,829,666.529234
54,614.931048
6.538479
293.933347
0
0
0.976862
Total CO2e
(t)
CO2
(t)
CH4
(t)
N2O
(t)
HFC
(t of CO2e)
PFC
(t of CO2e)
NF3
(t)
SF6
(t)
1,287,727.855388
1,282,412.714589
61.36559
12.988592
0
0
0
0
1,287,727.855388
1,282,412.714589
61.36559
12.988592
0
0
0
0
Stationary Combustion
Total
Scope 2 - Market Based Indirect Emissions
Purchased Electricity Market Based
Total
Pacific Gas and Electric Corporation
Emissions Year 2014
The Climate Registry
Page 3 of 27
Biogenic - Direct Emissions
Total CO2e
(t)
CO2
(t)
CH4
(t)
N2O
(t)
HFC
(t of CO2e)
PFC
(t of CO2e)
NF3
(t)
SF6
(t)
1,661.39505
1,661.39505
0
0
0
0
0
0
1,661.39505
1,661.39505
0
0
0
0
0
0
Total CO2e
(t)
CO2
(t)
CH4
(t)
N2O
(t)
HFC
(t of CO2e)
PFC
(t of CO2e)
NF3
(t)
SF6
(t)
52,808,738.403377
52,772,540.98354
696.021618
69.616019
0
0
0
0
52,808,738.403377
52,772,540.98354
696.021618
69.616019
0
0
0
0
Mobile Biomass Combustion
Total
Optional - Optional
Emissions
Scope 3
Total
Simplified Estimation Methods (SEMs)
Total Estimated CO2e (t)
Total Emissions (t of CO2e)
Estimated CO2e as a Percentage of Total*
Location Based
0
0
N/A
Market Based
173.154547
5,291,637.20074
0.00327223012503501%
*Total based on scope 1, scope 2 & biomass emissions
Pacific Gas and Electric Corporation
Emissions Year 2014
The Climate Registry
Page 4 of 27
Facility Emissions | Biodiesel Use by Fleet
Equity share - 100% | Entity controls the facility emissions - Yes
N/A, N/A, California, N/A, US
Scope 1 - Direct Emissions
Mobile Combustion
Total
Biogenic - Direct Emissions
Mobile Biomass Combustion
Total
Total CO2e
(t)
CO2 (t)
CH4 (t)
N2O (t)
HFC
(t of CO2e)
PFC
(t of CO2e)
NF3 (t)
SF6 (t)
7.722188
0
0.023292
0.023332
0
0
0
0
7.722188
0
0.023292
0.023332
0
0
0
0
Total CO2e
(t)
CO2 (t)
CH4 (t)
N2O (t)
HFC
(t of CO2e)
PFC
(t of CO2e)
NF3 (t)
SF6 (t)
1,661.39505
1,661.39505
0
0
0
0
0
0
1,661.39505
1,661.39505
0
0
0
0
0
0
Facility Emissions | Business Air Travel
Equity share - 100% | Entity controls the facility emissions - Yes
77 Beale Street, San Francisco, California, 94105, US
Optional - Optional Emissions
Scope 3
Total
Total CO2e
(t)
CO2 (t)
CH4 (t)
N2O (t)
HFC
(t of CO2e)
PFC
(t of CO2e)
NF3 (t)
SF6 (t)
2,645.89154
2,645.89154
0
0
0
0
0
0
2,645.89154
2,645.89154
0
0
0
0
0
0
Pacific Gas and Electric Corporation
Emissions Year 2014
The Climate Registry
Page 5 of 27
Facility Emissions | CNG Use by Fleet
Equity share - 100% | Entity controls the facility emissions - Yes
77 Beale St, San Francisco, California, 94105, US
Scope 1 - Direct Emissions
Mobile Combustion
Total
Total CO2e
(t)
CO2 (t)
CH4 (t)
N2O (t)
HFC
(t of CO2e)
PFC
(t of CO2e)
NF3 (t)
SF6 (t)
2,012.906486
1,803.505355
4.843801
0.347359
0
0
0
0
2,012.906486
1,803.505355
4.843801
0.347359
0
0
0
0
Facility Emissions | Colusa Generating Station
Equity share - 100% | Entity controls the facility emissions - Yes
5025 Delevan Rd., Maxwell, California, 95955, US
Scope 1 - Direct Emissions
Stationary Combustion
Total
Total CO2e
(t)
CO2 (t)
CH4 (t)
N2O (t)
HFC
(t of CO2e)
PFC
(t of CO2e)
NF3 (t)
SF6 (t)
967,022.972512
966,091.161034
17.919452
1.791945
0
0
0
0
967,022.972512
966,091.161034
17.919452
1.791945
0
0
0
0
Pacific Gas and Electric Corporation
Emissions Year 2014
The Climate Registry
Page 6 of 27
Facility Emissions | CSU East Bay Fuel Cells
Equity share - 100% | Entity controls the facility emissions - Yes
77 Beale, San Francisco, California, 94105, US
Scope 1 - Direct Emissions
Process
Total
Total CO2e
(t)
CO2 (t)
CH4 (t)
N2O (t)
HFC
(t of CO2e)
PFC
(t of CO2e)
NF3 (t)
SF6 (t)
3,845.58
3,845.58
0
0
0
0
0
0
3,845.58
3,845.58
0
0
0
0
0
0
Facility Emissions | Diesel Use by Fleet
Equity share - 100% | Entity controls the facility emissions - Yes
77 Beale St, San Francisco, California, 94105, US
Scope 1 - Direct Emissions
Mobile Combustion
Total
Total CO2e
(t)
CO2 (t)
CH4 (t)
N2O (t)
HFC
(t of CO2e)
PFC
(t of CO2e)
NF3 (t)
SF6 (t)
56,651.908395
56,610.20264
0.127439
0.125902
0
0
0
0
56,651.908395
56,610.20264
0.127439
0.125902
0
0
0
0
Pacific Gas and Electric Corporation
Emissions Year 2014
The Climate Registry
Page 7 of 27
Facility Emissions | Diesel Use by Stationary Sources
Equity share - 100% | Entity controls the facility emissions - Yes
77 Beale St, San Francisco, California, 94105, US
Scope 1 - Direct Emissions
Stationary Combustion
Total
Total CO2e
(t)
CO2 (t)
CH4 (t)
N2O (t)
HFC
(t of CO2e)
PFC
(t of CO2e)
NF3 (t)
SF6 (t)
681.518475
679.232502
0.027542
0.005508
0
0
0
0
681.518475
679.232502
0.027542
0.005508
0
0
0
0
Facility Emissions | Electricity Purchased for PG&E Customers
Equity share - 100% | Entity controls the facility emissions - Yes
77 Beale Street, San Francisco, California, 94105, US
Optional - Optional Emissions
Total CO2e
(t)
CO2 (t)
CH4 (t)
N2O (t)
HFC
(t of CO2e)
PFC
(t of CO2e)
NF3 (t)
SF6 (t)
Scope 3
15,906,574
15,906,574
0
0
0
0
0
0
15,906,574
15,906,574
0
0
0
0
0
0
Total
Pacific Gas and Electric Corporation
Emissions Year 2014
The Climate Registry
Page 8 of 27
Facility Emissions | Electricity Transmission and Distribution Losses
Equity share - 100% | Entity controls the facility emissions - Yes
N/A, N/A, California, N/A, US
Scope 2 - Market Based - Indirect
Emissions
Purchased Electricity - Market Based
Total
Total CO2e
(t)
CO2 (t)
CH4 (t)
N2O (t)
HFC
(t of CO2e)
PFC
(t of CO2e)
NF3 (t)
SF6 (t)
1,236,653.446706
1,231,677.71635
57.448181
12.159092
0
0
0
0
1,236,653.446706
1,231,677.71635
57.448181
12.159092
0
0
0
0
Facility Emissions | Electricity Use
Equity share - 100% | Entity controls the facility emissions - Yes
77 Beale St, San Francisco, California, 94105, US
Scope 2 - Market Based - Indirect
Emissions
Purchased Electricity - Market Based
Total
Total CO2e
(t)
CO2 (t)
CH4 (t)
N2O (t)
HFC
(t of CO2e)
PFC
(t of CO2e)
NF3 (t)
SF6 (t)
24,419.844351
24,257.42555
1.875235
0.3969
0
0
0
0
24,419.844351
24,257.42555
1.875235
0.3969
0
0
0
0
Pacific Gas and Electric Corporation
Emissions Year 2014
The Climate Registry
Page 9 of 27
Download Emissions Report
Emissions_Report.pdf (PDF, 851.02 KB)
Download PDF
Share this file on social networks
Link to this page
Permanent link
Use the permanent link to the download page to share your document on Facebook, Twitter, LinkedIn, or directly with a contact by e-Mail, Messenger, Whatsapp, Line..
Short link
Use the short link to share your document on Twitter or by text message (SMS)
HTML Code
Copy the following HTML code to share your document on a Website or Blog
QR Code to this page

This file has been shared publicly by a user of PDF Archive.
Document ID: 0000519961.