TS Poster (PDF)
File information
Title: PowerPoint Presentation
Author: Caroline Pearson
This PDF 1.5 document has been generated by Microsoft® PowerPoint® 2010, and has been sent on pdf-archive.com on 03/03/2017 at 14:14, from IP address 194.176.x.x.
The current document download page has been viewed 350 times.
File size: 496.12 KB (1 page).
Privacy: public file
File preview
$$$ The More You Have The Less You Give? $$$
Studies have often shown links
between generosity and economic
status. Perversely studies have
shown lower socioeconomic status
individuals tend to give more,
contrary to logical reasoning that
the more you have the more you
are able to give.
Piff et al 2010 hypothesise that
lower class individuals orient to
the welfare of others by giving
more as a means of adapting to
their own hostile environments.
We examined this link with the
Hurricane Katrina data using the
variable household income and
then examined correlations
between this variable and amount
given.
Methods: Participants were asked
to decide how they would divide
$100 between a welfare charity for
Hurricane Katrina victims and
themselves.
Predicted Results: The team
predicted that the amount
participants earned would have an
effect on the amount donated. We
predicted that the amount earned
would have an inverse effect on
the amount given: the more
individuals earn the less they
would give. We planned to use a
one way ANOVA to assess the data.
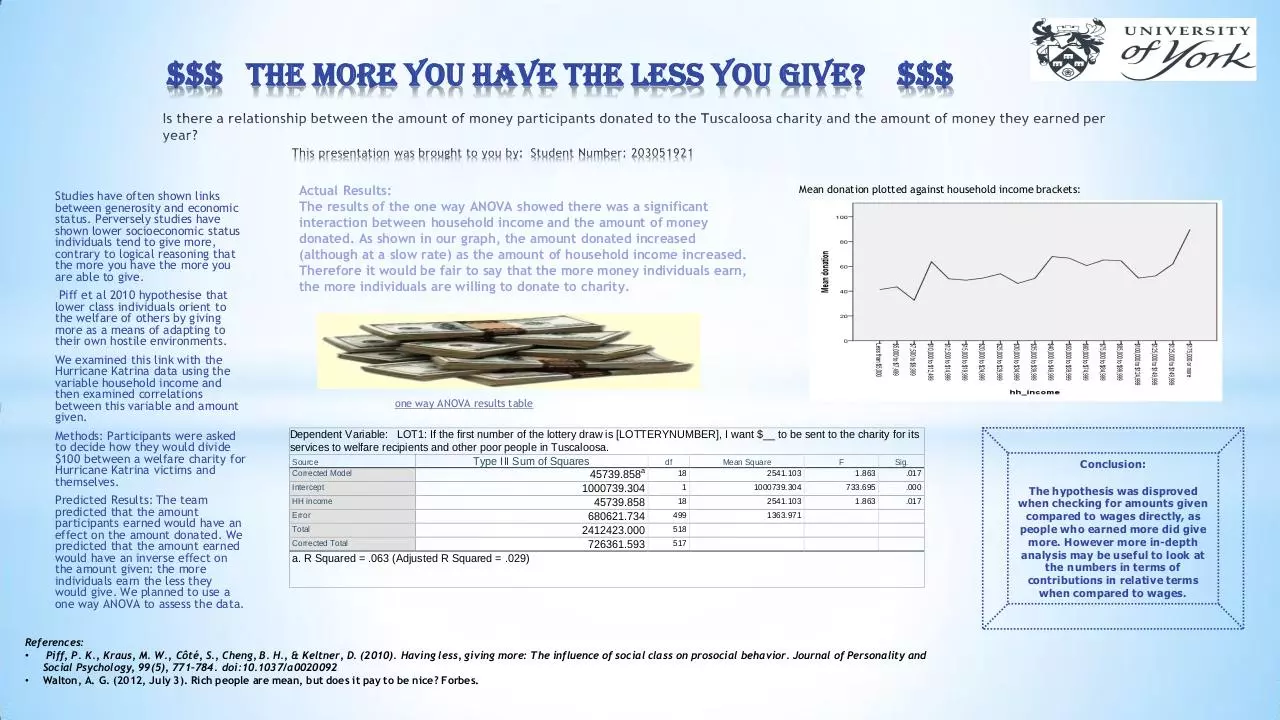
Actual Results:
The results of the one way ANOVA showed there was a significant
interaction between household income and the amount of money
donated. As shown in our graph, the amount donated increased
(although at a slow rate) as the amount of household income increased.
Therefore it would be fair to say that the more money individuals earn,
the more individuals are willing to donate to charity.
Mean donation plotted against household income brackets:
one way ANOVA results table
Dependent Variable: LOT1: If the first number of the lottery draw is [LOTTERYNUMBER], I want $__ to be sent to the charity for its
services to welfare recipients and other poor people in Tuscaloosa.
Type III Sum of Squares
Source
df
Mean Square
F
Sig.
Corrected Model
18
2541.103
1.863
.017
45739.858a
Intercept
1
1000739.304
733.695
.000
1000739.304
HH income
18
2541.103
1.863
.017
45739.858
Error
499
1363.971
680621.734
Total
518
2412423.000
Corrected Total
517
726361.593
a. R Squared = .063 (Adjusted R Squared = .029)
References:
•
Piff, P. K., Kraus, M. W., Côté, S., Cheng, B. H., & Keltner, D. (2010). Having less, giving more: The influence of social class on prosocial behavior. Journal of Personality and
Social Psychology, 99(5), 771–784. doi:10.1037/a0020092
• Walton, A. G. (2012, July 3). Rich people are mean, but does it pay to be nice? Forbes.
Conclusion:
The hypothesis was disproved
when checking for amounts given
compared to wages directly, as
people who earned more did give
more. However more in-depth
analysis may be useful to look at
the numbers in terms of
contributions in relative terms
when compared to wages.
Download TS Poster
TS Poster.pdf (PDF, 496.12 KB)
Download PDF
Share this file on social networks
Link to this page
Permanent link
Use the permanent link to the download page to share your document on Facebook, Twitter, LinkedIn, or directly with a contact by e-Mail, Messenger, Whatsapp, Line..
Short link
Use the short link to share your document on Twitter or by text message (SMS)
HTML Code
Copy the following HTML code to share your document on a Website or Blog
QR Code to this page

This file has been shared publicly by a user of PDF Archive.
Document ID: 0000563586.