Challenge 2 (PDF)
File information
This PDF 1.4 document has been generated by Google / , and has been sent on pdf-archive.com on 04/10/2017 at 05:25, from IP address 155.41.x.x.
The current document download page has been viewed 411 times.
File size: 1.48 MB (17 pages).
Privacy: public file


File preview
EC 544 Challenge 2
Technical Details
Group 8:
Anthony Pasquariello,
Brian Kim,
Jade Dhangwattanotai,
Paul Ngouchet
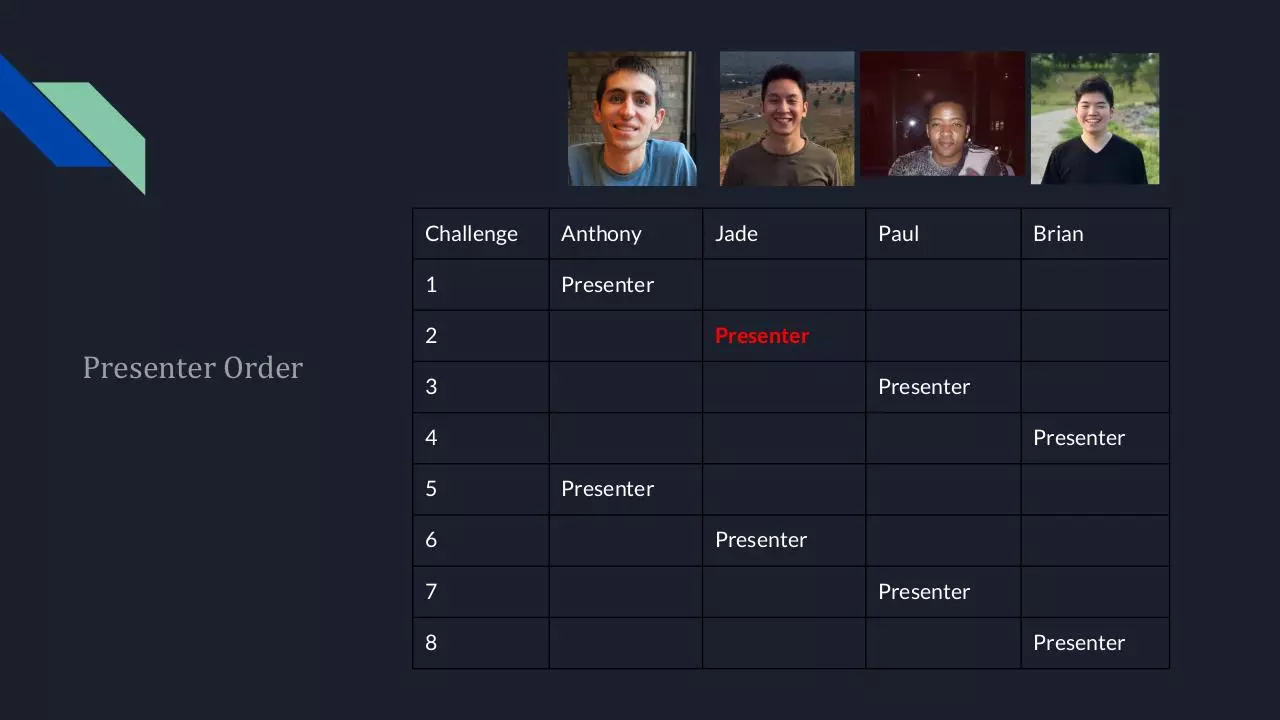
Challenge
Anthony
1
Presenter
2
Presenter Order
Jade
Paul
Presenter
3
Presenter
4
5
6
7
8
Brian
Presenter
Presenter
Presenter
Presenter
Presenter
Responsibility Breakdown
Anthony
Brian
Paul
Jade
Worked on data
representation design for
database. Also worked on
getting real time graphing
functionality working.
Configured plotting library
for visual charting
functionality.
Worked on the front-end
visualization and delivering
live data from MongoDB to
the front-end using
express and AngularJS.
Rendered the delivered
data in real-time visuals.
Set up the raspberry pi as
a server using mongodb.
Worked on designing the
database and schema and
provided the foundation of
the websites. Built and
designed the website
hosting the historical data
representation.
Implemented live data
streaming function. Helped
design data storage
system, database
configuration. Configured
express with interactive
graphing tool for data
visualization.
Design Concept
●
MongoDB as data storage
○
●
Canvas.JS as visuals
○
○
●
A central computer for local hosting, and the Raspberry Pi for cloud hosting are configured as the
coordinator, receiving data from multiple arduino devices. Once data reaches the computer, the average
temperature is computed in Fahrenheit. The average temperature and each arduino temperature is then
sent to the MongoDB on the Raspberry Pi.
Real Time Data:
■
The real time graph continuously retrieves temperature data coming from the Mongo database
that asynchronously stored data from XBee communication. This allows for low latency, efficient
rendering.
Historical Data:
■
This data is queried from MongoDB. The data is queried using http get from angular to the
express and node js. The data are received and displayed using graphing function canvas js on the
website
Express as data delivery tool
○
Data Storage Model
Data Storage Model - Components
●
●
●
●
Arduino with XBEE
○ Communicates to the database using socket.io
Node.js / Express
○ These tools allow for
MongoDB/Mongoose
○ This duo allows us to easily format and create the database
Front-End
○ AngularJS renders the front-end for both real-time and historical
visuals.
Design Concept Explained- Real Time
●
MongoDB <-> Mongoose
○
As soon as the program starts, a MongoDB is created with a schema that is created by Mongoose.
Mongoose is an extension of MongoDB that facilitates creating database with user-defined schemes.
Then, for every data that is received in the Xbee, the data gets stored using the format outlined.
Design Concept Explained- Real Time
●
Express as data delivery tool
○
Using the database that now contains xbee names and their temperatures, express sends the latest data
to controller.js, which communicates to the front end later. Notice that “sort({$natural:-1})” allows us to
query the latest reading!
Design Concept Explained- Real Time
●
AngularJs as rendering and delivery to the front-end
○
Controller.js
Using AngularJS, the data retrieved using Express gets processed. The processed data then delivers to
the front index.html! Notice that the $interval function occurs every second to constantly retrieve the
latest temperature reading
Index.html
Download Challenge 2
Challenge 2.pdf (PDF, 1.48 MB)
Download PDF
Share this file on social networks
Link to this page
Permanent link
Use the permanent link to the download page to share your document on Facebook, Twitter, LinkedIn, or directly with a contact by e-Mail, Messenger, Whatsapp, Line..
Short link
Use the short link to share your document on Twitter or by text message (SMS)
HTML Code
Copy the following HTML code to share your document on a Website or Blog
QR Code to this page

This file has been shared publicly by a user of PDF Archive.
Document ID: 0000680937.