Amir Poster (PDF)
File information
Title: PowerPoint Presentation
Author: Amirhossein Naemi
This PDF 1.5 document has been generated by Microsoft® PowerPoint® 2013, and has been sent on pdf-archive.com on 26/04/2018 at 21:43, from IP address 68.235.x.x.
The current document download page has been viewed 132 times.
File size: 3.03 MB (1 page).
Privacy: public file
File preview
Study on possible new landfill in Shelby County
Amirhossein Naemi
Department of Civil Engineering, University of Memphis
Abstract
Landfills are known as the cheapest form of disposal of solid wastes, and it is
the most common procedure of disposal in the world. Finding a location for
landfill sites is a difficult task due to the identification and selection process
which involves a series of demographic and topographic factors and strict
regulations. For optimal identification and site selection, using GIS tools is
crucial. In this research, attempts have been made to determine the best
location of new landfills in Shelby County, TN.
Methodology
Based on the factors that mentioned earlier, first the potential locations for the
new landfill should be found. First of all, the vacant area should be analyzed.
The best way to do this, maybe preparing a GIS map, contrasting the vacant
area. This way, these areas can be identified visually.
Candidate number 2
Candidate number 3
Health concerns
Accessibility to
area with current
Closeness to
Population density
parcels
landfills
highway
cover
6
3
5
4
7
5
2
4
7
5
4
8
7
Overlap of
Three candidates are chosen in the white (vacant) areas. Before choosing these
three points, all considerable factors such as population, accessibility, water
concerns and other important factors considered. Also, set in point not close to
previous landfills are considered because it is supposed to cover a new area and
minimize the travels of collection vehicles, not an extra landfill next to existing
landfill. These three are examples for small test. It is obvious that the higher
number of candidates, will results in higher quality of results and details. These
three candidates are shown in Figure 2.
Another important thing should be considered, is service area and accessibility.
In these three candidates, each of them are assumed to service for 10 miles like
the assumption for the previous landfills. So it is better to not to overlap the
south and north Shelby landfills. It should be remembered the new landfill is
supposed to cover new areas and distribute the collection routes wisely. Other
factor is being close to the high populated area while not located in the
residential areas at the same time. So this makes choosing more sensitive
because of public oppose (Figure 3).
Health
Accessibility with current Closeness to
Population
location
concerns
to parcels
landfills
highway
Candidate number 1
42
20
14
20
49
145
Candidate number 2
21
35
28
16
35
135
Candidate number 3
35
25
49
32
35
176
density cover Total Score
5
As mentioned above, optimal collection happens in populated areas so
candidates are supposed to being close to populated areas and not located in
residential areas at the same time. These three candidates meet the
requirement for not to be close to residential areas. Number 1 seems to be the
best due to being close to high populated areas. Candidate three has a big
advantage over the others and it is being close to main highways but in case of
being close to high density areas is not a good option.
The overall score of each candidate was obtained by summation of all scores
assigned to it. This scoring system provides a ranking system, and one may
choose the best option among candidates by looking at its score. The final
results shows that the best candidate is candidate number 3, with overall
score of 176. If this candidate is not going to be chosen, the next best
candidate would be candidate number 1 (Figure 4).
To do the numerical comparison on the three candidates, a Table 1 was
established. This table contains a score, ranging from 1 to 10. The higher value,
represents better performance. The values are based on engineering judgmental,
and make the decision making easier and more precise.
Obviously, each individual may have different clue about the values in Table 1.
The better analysis can be done by collecting the judgments from a number of
engineers and professionals, and use the average aggregated values overall of
them.
It is clear that, each of the factors mentioned in Table 1 does not have the same
importance, and value to the decision maker. To better analyze this issue, Table
2 was established, showing the importance of each individual parameters in
Table 1. Similar to Table 1, these values are based on engineering judgmental
method. The range is between 1 to 10. Value equals to 1 shows the least
importance, and value 10 shows the most importance factor. The higher values of
importance, will results in more participation of that factor in final decision.
Table 2 the preferred magnitude of importance of each factor
service area
Potential
Health
Accessibility to
with current
Closeness to
Population
location
concerns
parcels
landfills
highway
density cover
7
5
7
4
7
Importance of
each factor
Combination of Table 1 and Table 2 can be done by multiplying the importance of
each factor into its associated score of each candidate. This results is provided in
third column on Table 3.
The results and conclusion are discussed in the next section.
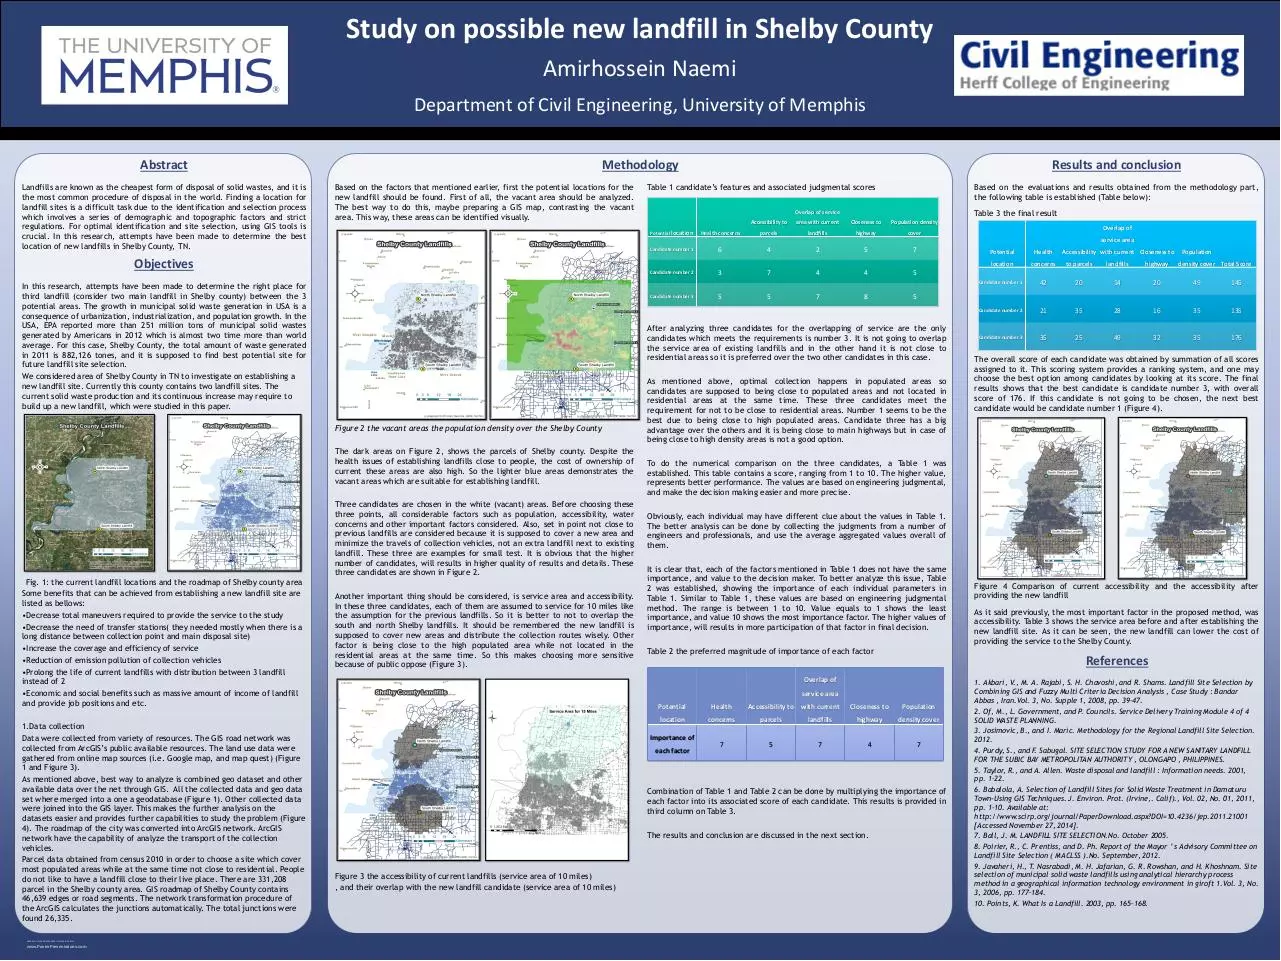
Figure 4 Comparison of current accessibility and the accessibility after
providing the new landfill
As it said previously, the most important factor in the proposed method, was
accessibility. Table 3 shows the service area before and after establishing the
new landfill site. As it can be seen, the new landfill can lower the cost of
providing the service to the Shelby County.
References
Overlap of
Figure 3 the accessibility of current landfills (service area of 10 miles)
, and their overlap with the new landfill candidate (service area of 10 miles)
Potential
5
After analyzing three candidates for the overlapping of service are the only
candidates which meets the requirements is number 3. It is not going to overlap
the service area of existing landfills and in the other hand it is not close to
residential areas so it is preferred over the two other candidates in this case.
The dark areas on Figure 2, shows the parcels of Shelby county. Despite the
health issues of establishing landfills close to people, the cost of ownership of
current these areas are also high. So the lighter blue areas demonstrates the
vacant areas which are suitable for establishing landfill.
www.PosterPresentations.com
Table 3 the final result
Overlap of service
Candidate number 1
Figure 2 the vacant areas the population density over the Shelby County
RESEARCH POSTER PRESENTATION DESIGN © 2012
Based on the evaluations and results obtained from the methodology part,
the following table is established (Table below):
service area
In this research, attempts have been made to determine the right place for
third landfill (consider two main landfill in Shelby county) between the 3
potential areas. The growth in municipal solid waste generation in USA is a
consequence of urbanization, industrialization, and population growth. In the
USA, EPA reported more than 251 million tons of municipal solid wastes
generated by Americans in 2012 which is almost two time more than world
average. For this case, Shelby County, the total amount of waste generated
in 2011 is 882,126 tones, and it is supposed to find best potential site for
future landfill site selection.
We considered area of Shelby County in TN to investigate on establishing a
new landfill site. Currently this county contains two landfill sites. The
current solid waste production and its continuous increase may require to
build up a new landfill, which were studied in this paper.
1.Data collection
Data were collected from variety of resources. The GIS road network was
collected from ArcGIS’s public available resources. The land use data were
gathered from online map sources (i.e. Google map, and map quest) (Figure
1 and Figure 3).
As mentioned above, best way to analyze is combined geo dataset and other
available data over the net through GIS. All the collected data and geo data
set where merged into a one a geodatabase (Figure 1). Other collected data
were joined into the GIS layer. This makes the further analysis on the
datasets easier and provides further capabilities to study the problem (Figure
4). The roadmap of the city was converted into ArcGIS network. ArcGIS
network have the capability of analyze the transport of the collection
vehicles.
Parcel data obtained from census 2010 in order to choose a site which cover
most populated areas while at the same time not close to residential. People
do not like to have a landfill close to their live place. There are 331,208
parcel in the Shelby county area. GIS roadmap of Shelby County contains
46,639 edges or road segments. The network transformation procedure of
the ArcGIS calculates the junctions automatically. The total junctions were
found 26,335.
Table 1 candidate’s features and associated judgmental scores
Potential location
Objectives
Fig. 1: the current landfill locations and the roadmap of Shelby county area
Some benefits that can be achieved from establishing a new landfill site are
listed as bellows:
•Decrease total maneuvers required to provide the service to the study
•Decrease the need of transfer stations( they needed mostly when there is a
long distance between collection point and main disposal site)
•Increase the coverage and efficiency of service
•Reduction of emission pollution of collection vehicles
•Prolong the life of current landfills with distribution between 3 landfill
instead of 2
•Economic and social benefits such as massive amount of income of landfill
and provide job positions and etc.
Results and conclusion
1. Akbari, V., M. A. Rajabi, S. H. Chavoshi, and R. Shams. Landfill Site Selection by
Combining GIS and Fuzzy Multi Criteria Decision Analysis , Case Study : Bandar
Abbas , Iran.Vol. 3, No. Supple 1, 2008, pp. 39–47.
2. Of, M., L. Government, and P. Councils. Service Delivery Training Module 4 of 4
SOLID WASTE PLANNING.
3. Josimovic, B., and I. Maric. Methodology for the Regional Landfill Site Selection.
2012.
4. Purdy, S., and F. Sabugal. SITE SELECTION STUDY FOR A NEW SANITARY LANDFILL
FOR THE SUBIC BAY METROPOLITAN AUTHORITY , OLONGAPO , PHILIPPINES.
5. Taylor, R., and A. Allen. Waste disposal and landfill : Information needs. 2001,
pp. 1–22.
6. Babalola, A. Selection of Landfill Sites for Solid Waste Treatment in Damaturu
Town-Using GIS Techniques. J. Environ. Prot. (Irvine,. Calif)., Vol. 02, No. 01, 2011,
pp. 1–10. Available at:
http://www.scirp.org/journal/PaperDownload.aspx?DOI=10.4236/jep.2011.21001
[Accessed November 27, 2014].
7. Ball, J. M. LANDFILL SITE SELECTION.No. October 2005.
8. Poirier, R., C. Prentiss, and D. Ph. Report of the Mayor ’ s Advisory Committee on
Landfill Site Selection ( MACLSS ).No. September, 2012.
9. Javaheri, H., T. Nasrabadi, M. H. Jafarian, G. R. Rowshan, and H. Khoshnam. Site
selection of municipal solid waste landfills using analytical hierarchy process
method in a geographical information technology environment in giroft 1.Vol. 3, No.
3, 2006, pp. 177–184.
10. Points, K. What Is a Landfill. 2003, pp. 165–168.
Download Amir Poster
Amir Poster.pdf (PDF, 3.03 MB)
Download PDF
Share this file on social networks
Link to this page
Permanent link
Use the permanent link to the download page to share your document on Facebook, Twitter, LinkedIn, or directly with a contact by e-Mail, Messenger, Whatsapp, Line..
Short link
Use the short link to share your document on Twitter or by text message (SMS)
HTML Code
Copy the following HTML code to share your document on a Website or Blog
QR Code to this page

This file has been shared publicly by a user of PDF Archive.
Document ID: 0000761507.