PRICE TARGET REVISION | COMMENT
125 WEEKS
Rel. S&P/TSX COMPOSITE INDEX
17OCT08 - 03MAR11
HI-17OCT08 100.00
HI/LO DIFF -63.55%
90.00
75.00
CLOSE
60.00
45.00
2009
2010
2011
ON D J F M A M J J A S O N D J F M A M J J A S O N D J F M
79.66
LO-13MAR09 36.45
MARCH 4, 2011
Trinidad Drilling Ltd.
(TSX: TDG)
Momentum Building; Estimates Rise
HI-04MAR11 8.43
LO/HI DIFF 330.10%
8.00
6.00
4.00
CLOSE
8.23
LO-06MAR09
1.96
Outperform
Average Risk
Price:
2.00
4500
PEAK VOL. 6237.6
VOLUME
2335.9
3000
1500
8.23
Units O/S (MM):
Distribution:
120.8
0.20
Price Target:
Implied All-In Return:
Market Cap (MM):
Yield:
Avg. Daily Volume (MM):
11.00 ↑ 10.00
36%
994
2.4%
0.52
RBC Dominion Securities Inc.
Event
Dan MacDonald, CFA (Analyst)
(403) 299-2394; dan.macdonald@rbccm.com
TDG reported Q4/10 EBITDA of $63.4MM, ahead of our estimate of $61.5MM
and well above consensus of $57.6MM.
Matthew Vines (Associate)
(403) 299-5042; matthew.vines@rbccm.com
Investment Opinion
FY Dec
Adj EPS - FD
Prev.
P/AEPS
EBITDA (MM)
Prev.
EV/EBITDA
Prev.
2009A
(0.21)
Adj EPS - FD
2009
2010
Prev.
2011
EBITDA (MM)
2009
2010
Prev.
2011
Q1
Q2
Q3
Q4
(0.06)A (0.09)A (0.10)A
0.03A
(0.01)A
0.05A
0.00A (0.73)A
0.07E
0.19E
0.03E
0.18E
0.22E
NM
194.0
6.9x
2010A
(0.68)
0.12
NM
198.1
196.2
7.9x
7.5x
2011E
0.61
0.39
13.5x
277.2
247.1
5.7x
5.8x
65.0A
53.0A
40.0A
34.0A
41.0A
48.0A
7,702.0E
47.5E
71.9E
All values in CAD unless otherwise noted.
2012E
0.71
0.55
11.6x
299.0
274.8
4.8x
47.0A
63.4A
61.5E
80.6E
TDG is rated Outperform. We view TDG as one of the best ways to play the
growing momentum for deep drilling rigs in Canada. We expect further pricing
power and margin expansion through 2011, driven by high utilization of deep
rigs, with TDG having one of the highest concentrations of deep drilling rigs in
our Canadian land drilling coverage group.
Price Target Increased to $11.00: Our 12-month price target has increased to
$11.00, based on an unchanged EV/EBITDA multiple of ~6.0x our revised 2012
estimates. This is the median of the company's historical (three-year) range (4.7
to 7.2) and in line with its peers.
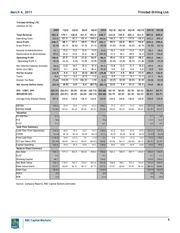
Increasing estimates: Our 2011/2012 EPS estimates increase to $0.61/$0.71,
respectively, up from $0.39/$0.55 previously and compared to current consensus
of $0.38/$0.50. See details on page 2.
Highlights and Catalysts
• Raising estimates. We have increased our 2011/2012 EBITDA estimates by
~12% and ~9% on the back of higher than forecast pricing and margin gains in
both Canada and the U.S. Gross margin of 41.1% in Q4/10 was ahead of our
prior FY11 estimate of 41%.
• Further pricing power and margin expansion is expected in 2011 as
demand is near all time highs for TDG's rigs. With utilization near
maximum and a solid demand outlook post spring break-up in Canada, we
expect further pricing power and margin expansion in 2011, as day rates remain
below prior peak levels.
• Valuation below TDG's historical median. TDG is currently trading at ~5.0x
our 2012E EV/EBITDA, compared to its 5-year median of ~6x, providing an
attractive entry point in light of improving fundamentals.
Risks
Declines in North American drilling activity due to declines in commodity prices
and the ability to source skilled labour.
Priced as of prior trading day's market close, EST (unless otherwise noted).
For Required Non-U.S. Analyst and Conflicts Disclosures, see page 6.
�
March 4, 2011
Trinidad Drilling Ltd.
Highlights and Outlook
•
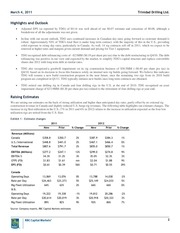
Adjusted EPS (as reported by TDG) of $0.14 was well ahead of our $0.07 estimate and consensus of $0.08, although a
breakdown of all the adjustments was not given.
•
In-line with our recent outlook, TDG sees continued increases in Canadian day rates going forward as customer demand is
robust. Approximately 50% of TDG's total fleet is under long term contract, with the majority of this in the U.S., providing
solid exposure to rising day rates, particularly in Canada. As well, 14 rig contracts roll off in 2011, which we expect to be
renewed at higher rates and margins given current demand and pricing for Tier 1 equipment.
•
TDG recognized debt refinancing costs of ~$23MM ($0.19 per share pre tax) due to the debt restructuring in Q4/10. The debt
refinancing was positive in our view and expected by the market, to simplify TDG's capital structure and replace convertible
shares due 2012 with long term debt at similar rates.
•
TDG also recognized a goodwill impairment on its rig construction business of $58.5MM (~$0.49 per share pre tax) in
Q4/10, based on its decision to focus this business solely on internal new rig builds going forward. We believe this indicates
TDG will resume a new build construction program in the near future, once the remaining two rigs from its 2010 build
program are completed in Q1/11. TDG typically initiates new builds once long term contracts are obtained.
•
TDG retired one drilling rig in Canada and four drilling rigs in the U.S. at the end of 2010. TDG recognized an asset
impairment charge of $23.9MM ($0.20 per share pre tax) related to the retirement of four drilling rigs at year-end.
Raising Estimates
We are raising our estimates on the back of strong utilization and higher than anticipated day rates, partly offset by no external rig
construction revenue in Canada and slightly reduced U.S. barge rig revenues. The following table highlights our estimate changes. The
increase in rig fleet utilization in the U.S. (7% in 2011 and 6% in 2012) relates to the increase in utilization expected as the four low
utilization rigs are retired from the U.S. fleet.
Exhibit 1 – Estimate changes
2011
2012
New
Prior
% Change
New
Prior
% Change
Canada
$358.8
$350.7
2%
$387.9
$384.3
1%
U.S./International
$448.8
$441.0
2%
$467.1
$466.4
0%
Total Revenue
$807.6
$791.7
2%
$855.0
$850.7
1%
EBITDA (Millions)
$277.2
$247.1
12%
$299.0
$274.8
9%
EBITDA %
34.3%
31.2%
3%
35.0%
32.3%
3%
CFPS (FD)
$1.83
$1.61
nm
$2.04
$1.88
9%
EPS (FD)
$0.61
$0.39
56%
$0.71
$0.55
29%
Operating Days
13,069
13,076
0%
13,788
14,030
-2%
Rate per Day
$24,463
$23,373
5%
$25,149
$24,033
5%
64%
63%
2%
66%
66%
0%
Revenue (Millions)
Canada
Rig Fleet Utilization
U.S.
Operating Days
19,222
19,338
-1%
19,812
20,286
-2%
Rate per Day
$20,614
$20,019
3%
$20,918
$20,323
3%
89%
82%
9%
92%
86%
7%
Rig Fleet Utilization
Source: Company reports, RBC Capital Markets estimates
2
�
March 4, 2011
Trinidad Drilling Ltd.
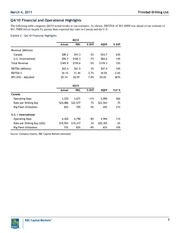
Q4/10 Financial and Operational Highlights
The following table compares Q4/10 actual results to our estimates. As shown, EBITDA of $63.4MM was ahead of our estimate of
$61.5MM driven largely by greater than expected day rates in Canada and the U.S.
Exhibit 2 – Q4/10 Financial Highlights
4Q10
Actual
RBC
% Diff
4Q09
% Diff
Revenue (Millions)
Canada
$89.2
$91.3
-2%
$54.7
63%
U.S./International
$96.7
$104.3
-7%
$84.6
14%
$185.9
$195.6
-5%
$139.3
33%
Total Revenue
EBITDA (Millions)
$63.4
$61.5
3%
$47.4
34%
EBITDA %
34.1%
31.4%
2.7%
34.0%
-2.6%
EPS (FD) - Adjusted
$0.14
$0.07
7.0%
$0.03
367%
4Q10
Actual
RBC
% Diff
4Q09
YoY %
3,270
3,671
-11%
2,090
56%
$24,086
$22,577
7%
$22,543
7%
65%
70%
-5%
44%
21%
4,430
4,790
-8%
3,994
11%
$19,955
$19,317
3%
$20,355
-2%
73%
82%
-9%
63%
10%
Canada
Operating Days
Rate per Drilling Day
Rig Fleet Utilization
U.S. / International
Operating Days
Rate per Drilling Day (US$)
Rig Fleet Utilization
Source: Company reports, RBC Capital Markets estimates
3
�
March 4, 2011
Trinidad Drilling Ltd.
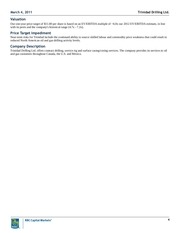
Valuation
Our one-year price target of $11.00 per share is based on an EV/EBITDA multiple of ~6.0x our 2012 EV/EBITDA estimate, in line
with its peers and the company's historical range (4.7x - 7.2x).
Price Target Impediment
Near-term risks for Trinidad include the continued ability to source skilled labour and commodity price weakness that could result in
reduced North American oil and gas drilling activity levels.
Company Description
Trinidad Drilling Ltd. offers contract drilling, service rig and surface casing/coring services. The company provides its services to oil
and gas customers throughout Canada, the U.S. and Mexico.
4
�
March 4, 2011
Trinidad Drilling Ltd.
Trinidad Drilling LTD.
(millions of C$)
2009
1Q10
2Q10
3Q10
4Q10
2010
1Q11E
2Q11E
3Q11E
4Q11E
2011E
2012E
855.0
Total Revenue
582.6
170.1
128.8
161.9
185.9
646.7
223.8
159.0
203.3
221.5
807.6
Operating Costs
335.8
101.9
81.7
101.4
109.5
394.6
130.3
97.1
117.9
126.9
472.2
495.4
Gross Profit
246.7
68.1
47.1
60.5
76.4
252.1
93.5
62.0
85.3
94.6
335.4
359.6
39.0%
41.8%
39.0%
42.0%
42.7%
Gross Profit %
42.4%
40.1%
36.6%
37.3%
41.1%
General & Administrative
53.1
15.2
13.2
12.6
13.0
53.9
16.3
14.5
13.4
14.0
58.2
60.6
Depreciation & Amortization
87.0
25.4
23.0
27.0
26.5
101.8
31.5
30.1
29.9
32.4
123.9
134.8
27.5
11.0
153.2
164.1
Operating Profit
42.1%
21.0
36.9
96.4
45.6
17.4
42.0
48.2
18.3%
16.2%
8.5%
13.0%
19.9%
14.9%
20.4%
10.9%
20.7%
21.8%
19.0%
19.2%
Net Interest Expense (Income)
56.6
13.8
14.7
15.2
37.4
81.2
12.8
12.5
11.7
10.6
47.6
42.2
Other (Incl SBC)
62.7
9.3
(9.9)
6.1
85.6
91.0
0.0
0.0
0.0
0.0
0.0
0.0
PreTax Income
(12.7)
4.4
6.2
(0.3)
(86.0)
(75.8)
32.9
4.9
30.4
37.5
105.7
122.0
Operating Profit %
Taxes
106.6
41.5%
9.6
5.2
0.2
1.6
6.3
9.9
1.5
9.1
11.3
31.7
36.6
-1.9%
-8.3%
30.0%
30.0%
30.0%
30.0%
30.0%
30.0%
(87.7)
(82.1)
23.0
3.4
21.3
26.3
74.0
85.4
$0.00
($0.73) ($0.68)
$0.19
$0.03
$0.18
$0.22
$0.61
$0.71
$0.00
($0.73) ($0.68)
$0.19
$0.03
$0.18
$0.22
$0.61
$0.71
120.8
120.8
120.8
120.8
120.8
120.8
-75.6%
118.0%
Net Income Before Items
(22.3)
(0.8)
6.0
0.4
EPS - CONT. OPS
($0.21) ($0.01)
$0.05
REPORTED EPS
($0.21) ($0.01)
$0.05
120.8
120.8
120.8
3.1%
(0.7)
Overall Tax Rate
Average Fully Diluted Shares
107.8
EBITDA
193.6
52.9
33.9
EBITDA/SHARE
$1.80
$0.44
$0.28
206.2%
120.8
120.8
47.9
63.4
198.1
77.2
47.5
71.9
80.6
277.2
299.0
$0.40
$0.52
$1.64
$0.64
$0.39
$0.60
$0.67
$2.29
$2.47
Valuation
EV/EBITDA
6.9
7.9
5.7
4.8
P/E
NA
NA
13.3
11.5
P/CF
5.3
6.7
4.5
4.5
221.2
247.0
Cash Flow Summary
Cash Flow From Operations
CFPSD
144.6
$1.34
40.6
19.3
34.2
52.5
61.8
34.6
57.8
67.0
$0.34
$0.16
$0.28
$0.43
146.6
$1.21
$0.51
$0.29
$0.48
$0.55
$1.83
$2.04
Free Cash Flow
(139.8)
10.0
(13.7)
7.9
(1.8)
2.4
9.8
17.6
(5.2)
15.0
37.2
178.0
FCF per Share (FD)
($1.30)
$0.08
($0.11)
$0.07
($0.02)
$0.02
$0.08
$0.15
($0.04)
$0.12
$0.31
$1.47
162.6
35.0
35.5
34.0
35.2
139.6
20.0
15.0
10.0
10.0
55.0
50.0
565.1
577.2
561.9
561.8
598.8
598.8
563.1
549.5
507.7
456.8
456.8
284.0
Capital Spending
Balance Sheet Summary
Net Debt
D/CF
3.9
4.1
2.1
1.1
Working Capital
90.7
126.8
139.8
293.6
Net Book Value
762.2
736.0
762.3
738.5
691.8
691.8
708.8
706.1
721.4
741.6
741.6
802.8
Book value/share
$7.07
$6.09
$6.31
$6.11
$5.72
$5.72
$5.87
$5.84
$5.97
$6.14
$6.14
$6.64
Debt/Cap
38.4%
43.8%
48.5%
46.6%
ROCE
-2%
-6%
6%
7%
ROE
-2%
-11%
9%
10%
Source: Company Reports, RBC Capital Markets estimates
5
�
March 4, 2011
Trinidad Drilling Ltd.
Required Disclosures
Non-U.S. Analyst Disclosure
Dan MacDonald and Matthew Vines (i) are not registered/qualified as research analysts with the NYSE and/or FINRA and (ii) may
not be associated persons of the RBC Capital Markets, LLC and therefore may not be subject to FINRA Rule 2711 and NYSE Rule
472 restrictions on communications with a subject company, public appearances and trading securities held by a research analyst
account.
Conflicts Disclosures
The analyst(s) responsible for preparing this research report received compensation that is based upon various factors, including total
revenues of the member companies of RBC Capital Markets and its affiliates, a portion of which are or have been generated by
investment banking activities of the member companies of RBC Capital Markets and its affiliates.
A member company of RBC Capital Markets or one of its affiliates received compensation for investment banking services from
Trinidad Drilling Ltd. in the past 12 months.
RBC Dominion Securities Inc. makes a market in the securities of Trinidad Drilling Ltd. and may act as principal with regard to sales
or purchases of this security.
A member company of RBC Capital Markets or one of its affiliates received compensation for products or services other than
investment banking services from Trinidad Drilling Ltd. during the past 12 months. During this time, a member company of RBC
Capital Markets or one of its affiliates provided non-securities services to Trinidad Drilling Ltd..
RBC Capital Markets is currently providing Trinidad Drilling Ltd. with non-securities services.
RBC Capital Markets has provided Trinidad Drilling Ltd. with investment banking services in the past 12 months.
RBC Capital Markets has provided Trinidad Drilling Ltd. with non-securities services in the past 12 months.
The author is employed by RBC Dominion Securities Inc., a securities broker-dealer with principal offices located in Toronto, Canada.
Explanation of RBC Capital Markets Equity Rating System
An analyst's 'sector' is the universe of companies for which the analyst provides research coverage. Accordingly, the rating assigned to
a particular stock represents solely the analyst's view of how that stock will perform over the next 12 months relative to the analyst's
sector average.
Ratings
Top Pick (TP): Represents best in Outperform category; analyst's best ideas; expected to significantly outperform the sector over 12
months; provides best risk-reward ratio; approximately 10% of analyst's recommendations.
Outperform (O): Expected to materially outperform sector average over 12 months.
Sector Perform (SP): Returns expected to be in line with sector average over 12 months.
Underperform (U): Returns expected to be materially below sector average over 12 months.
Risk Qualifiers (any of the following criteria may be present):
Average Risk (Avg): Volatility and risk expected to be comparable to sector; average revenue and earnings predictability; no
significant cash flow/financing concerns over coming 12-24 months; fairly liquid.
Above Average Risk (AA): Volatility and risk expected to be above sector; below average revenue and earnings predictability; may
not be suitable for a significant class of individual equity investors; may have negative cash flow; low market cap or float.
Speculative (Spec): Risk consistent with venture capital; low public float; potential balance sheet concerns; risk of being delisted.
Distribution of Ratings
For the purpose of ratings distributions, regulatory rules require member firms to assign ratings to one of three rating categories - Buy,
Hold/Neutral, or Sell - regardless of a firm's own rating categories. Although RBC Capital Markets' ratings of Top Pick/Outperform,
Sector Perform and Underperform most closely correspond to Buy, Hold/Neutral and Sell, respectively, the meanings are not the same
because our ratings are determined on a relative basis (as described above).
6
�
March 4, 2011
Trinidad Drilling Ltd.
Distribution of Ratings
RBC Capital Markets, Equity Research
Investment Banking
Serv./Past 12 Mos.
Rating
BUY[TP/O]
HOLD[SP]
SELL[U]
Count
Percent
Count
Percent
699
594
63
51.50
43.80
4.60
197
136
10
28.18
22.90
15.87
Rating and Price Target History for: Trinidad Drilling Ltd. as of 03-03-2011 (in CAD)
03/12/08
SP:10.5
04/01/08
SP:12.5
04/16/08
SP:13.5
05/08/08
SP:14
05/20/08
SP:15.5
07/10/08
SP:16
09/18/08
SP:13
10/15/08
SP:8
12/15/08
SP:5.5
02/20/09
SP:4
02/20/09
D:NR:NA
40
32
24
16
8
Q1
Q2
Q3
2008
05/13/10
I:SP:8
Q1
Q2
Q3
2009
08/12/10
SP:7.5
09/14/10
SP:6.5
11/11/10
SP:6
Q1
2010
01/18/11
SP:6.5
Q2
0
Q1
Q3
2011
02/08/11
OP:10
Legend:
TP: Top Pick; O: Outperform; SP: Sector Perform; U: Underperform; I: Initiation of Research Coverage; D: Discontinuation of Research Coverage; NR: Not Rated; NA: Not Available;
RL: Recommended List - RL: On: Refers to date a security was placed on a recommended list, while RL Off: Refers to date a security was removed from a recommended list.
Created by BlueMatrix
References to a Recommended List in the recommendation history chart may include one or more recommended lists or model
portfolios maintained by a business unit of the Wealth Management Division of RBC Capital Markets, LLC. These Recommended
Lists include the Prime Opportunity List (RL 3), a former list called the Private Client Prime Portfolio (RL 4), the Guided Portfolio:
Prime Income (RL 6), the Guided Portfolio: Large Cap (RL 7), the Guided Portfolio: Dividend Growth (RL 8), and the Guided
Portfolio: Midcap 111 (RL9). The abbreviation 'RL On' means the date a security was placed on a Recommended List. The
abbreviation 'RL Off' means the date a security was removed from a Recommended List.
Conflicts Policy
RBC Capital Markets Policy for Managing Conflicts of Interest in Relation to Investment Research is available from us on request. To
access our current policy, clients should refer to
https://www.rbccm.com/global/file-414164.pdf
or send a request to RBC CM Research Publishing, P.O. Box 50, 200 Bay Street, Royal Bank Plaza, 29th Floor, South Tower,
Toronto, Ontario M5J 2W7. We reserve the right to amend or supplement this policy at any time.
Dissemination of Research and Short-Term Trading Calls
RBC Capital Markets endeavors to make all reasonable efforts to provide research simultaneously to all eligible clients, having regard
to local time zones in overseas jurisdictions. RBC Capital Markets' equity research is posted to our proprietary websites to ensure
eligible clients receive coverage initiations and changes in ratings, targets and opinions in a timely manner. Additional distribution
may be done by the sales personnel via email, fax or regular mail. Clients may also receive our research via third-party vendors. Please
contact your investment advisor or institutional salesperson for more information regarding RBC Capital Markets' research. RBC
Capital Markets also provides eligible clients with access to SPARC on the Firm's proprietary INSIGHT website. SPARC contains
market color and commentary, and may also contain Short-Term Trade Ideas regarding the publicly-traded common equity of subject
companies on which the Firm currently provides equity research coverage. SPARC may be accessed via the following hyperlink:
https://www.rbcinsight.com. A Short-Term Trade Idea reflects the research analyst's directional view regarding the price of the subject
company's publicly-traded common equity in the coming days or weeks, based on market and trading events. A Short-Term Trade
Idea may differ from the price targets and recommendations in our published research reports reflecting the research analyst's views of
the longer-term (one year) prospects of the subject company, as a result of the differing time horizons, methodologies and/or other
factors. Thus, it is possible that a subject company's common equity that is considered a long-term 'sector perform' or even an
7
�
March 4, 2011
Trinidad Drilling Ltd.
'underperform' might be a short-term buying opportunity as a result of temporary selling pressure in the market; conversely, a subject
company's common equity rated a long-term 'outperform' could be considered susceptible to a short-term downward price correction.
Short-Term Trade Ideas are not ratings, nor are they part of any ratings system, and the Firm generally does not intend, nor undertakes
any obligation, to maintain or update Short-Term Trade Ideas. Securities and Short-Term Trade Ideas discussed in SPARC may not be
suitable for all investors and have not been tailored to individual investor circumstances and objectives, and investors should make
their own independent decisions regarding any securities or strategies discussed herein.
Analyst Certification
All of the views expressed in this report accurately reflect the personal views of the responsible analyst(s) about any and all of the
subject securities or issuers. No part of the compensation of the responsible analyst(s) named herein is, or will be, directly or
indirectly, related to the specific recommendations or views expressed by the responsible analyst(s) in this report.
Disclaimer
RBC Capital Markets is the business name used by certain subsidiaries of Royal Bank of Canada, including RBC Dominion Securities Inc., RBC Capital Markets, LLC,
Royal Bank of Canada Europe Limited and Royal Bank of Canada - Sydney Branch. The information contained in this report has been compiled by RBC Capital
Markets from sources believed to be reliable, but no representation or warranty, express or implied, is made by Royal Bank of Canada, RBC Capital Markets, its
affiliates or any other person as to its accuracy, completeness or correctness. All opinions and estimates contained in this report constitute RBC Capital Markets'
judgement as of the date of this report, are subject to change without notice and are provided in good faith but without legal responsibility. Nothing in this report
constitutes legal, accounting or tax advice or individually tailored investment advice. This material is prepared for general circulation to clients and has been prepared
without regard to the individual financial circumstances and objectives of persons who receive it. The investments or services contained in this report may not be
suitable for you and it is recommended that you consult an independent investment advisor if you are in doubt about the suitability of such investments or services. This
report is not an offer to sell or a solicitation of an offer to buy any securities. Past performance is not a guide to future performance, future returns are not guaranteed,
and a loss of original capital may occur. RBC Capital Markets research analyst compensation is based in part on the overall profitability of RBC Capital Markets, which
includes profits attributable to investment banking revenues. Every province in Canada, state in the U.S., and most countries throughout the world have their own laws
regulating the types of securities and other investment products which may be offered to their residents, as well as the process for doing so. As a result, the securities
discussed in this report may not be eligible for sale in some jurisdictions. This report is not, and under no circumstances should be construed as, a solicitation to act as
securities broker or dealer in any jurisdiction by any person or company that is not legally permitted to carry on the business of a securities broker or dealer in that
jurisdiction. To the full extent permitted by law neither RBC Capital Markets nor any of its affiliates, nor any other person, accepts any liability whatsoever for any
direct or consequential loss arising from any use of this report or the information contained herein. No matter contained in this document may be reproduced or copied
by any means without the prior consent of RBC Capital Markets.
Additional information is available on request.
To U.S. Residents:
This publication has been approved by RBC Capital Markets, LLC (member FINRA, NYSE), which is a U.S. registered broker-dealer and which accepts responsibility
for this report and its dissemination in the United States. Any U.S. recipient of this report that is not a registered broker-dealer or a bank acting in a broker or dealer
capacity and that wishes further information regarding, or to effect any transaction in, any of the securities discussed in this report, should contact and place orders with
RBC Capital Markets, LLC.
To Canadian Residents:
This publication has been approved by RBC Dominion Securities Inc.(member IIROC). Any Canadian recipient of this report that is not a Designated Institution in
Ontario, an Accredited Investor in British Columbia or Alberta or a Sophisticated Purchaser in Quebec (or similar permitted purchaser in any other province) and that
wishes further information regarding, or to effect any transaction in, any of the securities discussed in this report should contact and place orders with RBC Dominion
Securities Inc., which, without in any way limiting the foregoing, accepts responsibility for this report and its dissemination in Canada.
To U.K. Residents:
This publication has been approved by Royal Bank of Canada Europe Limited ('RBCEL') which is authorized and regulated by Financial ServicesAuthority ('FSA'), in
connection with its distribution in the United Kingdom. This material is not for general distribution in the United Kingdom to retail clients, as defined under the rules of
the FSA. However, targeted distribution may be made to selected retail clients of RBC and its affiliates. RBCEL accepts responsibility for this report and its
dissemination in the United Kingdom.
To Persons Receiving This Advice in Australia:
This material has been distributed in Australia by Royal Bank of Canada - Sydney Branch (ABN 86 076 940 880, AFSL No. 246521). This material has been prepared
for general circulation and does not take into account the objectives, financial situation or needs of any recipient. Accordingly, any recipient should, before acting on
this material, consider the appropriateness of this material having regard to their objectives, financial situation and needs. If this material relates to the acquisition or
possible acquisition of a particular financial product, a recipient in Australia should obtain any relevant disclosure document prepared in respect of that product and
consider that document before making any decision about whether to acquire the product.
To Hong Kong Residents:
This publication is distributed in Hong Kong by RBC Investment Services (Asia) Limited and RBC Investment Management (Asia) Limited, licensed corporations
under the Securities and Futures Ordinance or, by Royal Bank of Canada, Hong Kong Branch, a registered institution under the Securities and Futures Ordinance. This
material has been prepared for general circulation and does not take into account the objectives, financial situation, or needs of any recipient. Hong Kong persons
wishing to obtain further information on any of the securities mentioned in this publication should contact RBC Investment Services (Asia) Limited, RBC Investment
Management (Asia) Limited or Royal Bank of Canada, Hong Kong Branch at 17/Floor, Cheung Kong Center, 2 Queen's Road Central, Hong Kong (telephone number
is 2848-1388).
To Singapore Residents:
This publication is distributed in Singapore by RBC (Singapore Branch) and RBC (Asia) Limited, registered entities granted offshore bank status by the Monetary
Authority of Singapore. This material has been prepared for general circulation and does not take into account the objectives, financial situation, or needs of any
recipient. You are advised to seek independent advice from a financial adviser before purchasing any product. If you do not obtain independent advice, you should
consider whether the product is suitable for you. Past performance is not indicative of future performance.
.® Registered trademark of Royal Bank of Canada. RBC Capital Markets is a trademark of Royal Bank of Canada. Used under license.
Copyright © RBC Capital Markets, LLC 2011 - Member SIPC
Copyright © RBC Dominion Securities Inc. 2011 - Member CIPF
Copyright © Royal Bank of Canada Europe Limited 2011
Copyright © Royal Bank of Canada 2011
All rights reserved
8
�
 Historical archive . public document