1
Economic Impact of Operating Coronado Canyons, a Vacant
Mixed-Use Commercial Building in Henderson, NV, as Part of
an Existing EB-5 Regional Center located in Clark County, NV
Prepared for:
Nevada California Regional Center, LLC
Las Vegas, NV
Prepared by:
Michael K. Evans
Evans, Carroll & Associates, Inc.
2785 NW 26th St.
Boca Raton, FL 33434
561-470-9035
mevans@evanscarrollecon.com
July, 2011
�
2
Table of Contents
1. Executive Summary
3
2. Tabulation of Principal Results
4
3. Introduction and Scope of Work
7
4. Brief Discussion of RIMS II model
8
5. Economic Parameters for Clark County
12
6. Location of Clark County and Coronado Canyons
15
7. Economic Impact of Renovation Expenditures
17
8. Discussion of Revenue and Employment, and Economic Impact, for Retail Space
and Restaurants
20
9. Discussion of Revenue and Employment, and Economic Impact, for Office Space 23
10. Summary Statistics for Entire Project
28
�
3
1. Executive Summary
●
Nevada California Regional Center, LLC plans to purchase a currently vacant
mixed use commercial building located at 650 S. Green Valley Pkwy., Henderson, NV
89052, which is in Clark County. The building consists of four units, with first-floor retail
space of about 74,760 square feet and second-floor office space of approximately
13,800 square feet, for a total of 88,560 square feet. The building is located within the
Green Valley Ranch master planned community, with close access to the Green Valley
Corporate Center, Green Valley Ranch Resort and Casino, the District, and St. Rose
Hospital. The Nevada California Regional Center, LLC has already received approval
for an EB-5 regional center in Clark County and other areas.
● The office space may be filled by a variety of professional services, including lawyers,
accountants and tax preparers, architects and engineers, computer designers and
programmers, management and technical consultants, and advertising and public
relations personnel. These jobs will generate total billings of $7.0 million per year.
When multiplied by the RIMS II weighted average final demand multiplier of 16.47 for
these six types of professional services, that will create 115 permanent new jobs.
● The retail space will consist of a variety of stores and shops, with total annual
revenue estimated at $41.1 million, which translates into approximately $18.5 million in
value added. When multiplied by the RIMS II final demand multiplier for Clark County
for retail trade of 19.93, those operations will create 369 permanent new jobs. The
restaurant space will have an estimated annual revenue of 2.6 million, which will create
65 permanent new jobs.
● Renovation expenditures are expected to average $50 per square foot for the 88,560
square feet, for a total of $4.43 million. The indirect and induced job creation from this
activity is estimated at 32 new jobs.
● Combining these figures, there will be a total of 115 jobs from office
operations, 369 jobs from retail operations, 65 jobs from restaurant operations,
and 32 jobs from construction expenditures, for a total of 581 permanent new
jobs created by this project (see Table A for details).
● The annual increase in output for this project is estimated at $52.7 million, and the
annual increase in household earnings is estimated at $17.6 million.
● Because the unemployment rate in the State of Nevada rose to 14.9% last year, the
entire state is a TEA. Hence a total of 581 jobs means that up to 58 EB-5 investors can
participate in this project, and raise up to $29 million.
�
4
2. Tabulation of Principal Results and Schematic Diagram
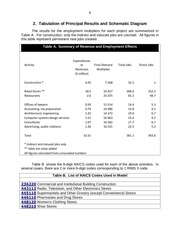
The results for the employment multipliers for each project are summarized in
Table A. For construction, only the indirect and induced jobs are counted. All figures in
this table represent permanent new jobs created.
Table A. Summary of Revenue and Employment Effects
Expenditures
or
Revenues
($ million)
Final Demand
Multiplier
Construction *
4.43
7.268
32.2
x
Retail Stores **
Restaurants
18.5
2.6
19.927
25.075
368.6
65.2
252.5
48.7
Offices of lawyers
Accounting, tax preparation
Architectural, engineering
Computer systems design services
Consultants
Advertising, public relations
0.93
0.79
1.32
1.51
1.07
1.36
15.514
19.986
14.372
16.963
16.582
16.531
14.4
15.8
19.0
25.6
17.7
22.5
5.3
9.2
6.7
9.2
6.7
5.3
581.1
343.6
Activity
Total
32.51
Total Jobs
Direct Jobs
* Indirect and induced jobs only
** Sales are value added
All figures calculated from unrounded numbers
Table B shows the 6-digit NAICS codes used for each of the above activities. In
several cases, there are 2 or more 6-digit codes corresponding to 1 RIMS II code.
Table B. List of NAICS Codes Used in Model
236220 Commercial and Institutional Building Construction
443112 Radio, Television, and Other Electronics Stores
445110 Supermarkets and Other Grocery (except Convenience) Stores
446110 Pharmacies and Drug Stores
448120 Women's Clothing Stores
448210 Shoe Stores
�
5
448310 Jewelry Stores
451110 Sporting Goods Stores
452112 Discount Department Stores
453220 Gift, Novelty, and Souvenir Stores
722110 Full-Service Restaurants
541110 Offices of Lawyers
541211 Offices of Certified Public Accountants
541310 Architectural Services
541330 Engineering Services
541512 Computer Systems Design Services
541611 Administrative Management and General Management Consulting Services
541618 Other Management Consulting Services
541810 Advertising Agencies
541820 Public Relations Agencies
If all the buildings in the proposed regional center were to be completely finished
and occupied within two and a half years, the economic impact as measured by
household earnings, demand for business services, utilities, maintenance and repair,
and new supplier and vendor relationships is summarized in Table C.
Table C. Summary Measures of Economic Impact for All Buildings in Regional
Center
Category
All figures in thousands of dollars
Household income from:
Construction jobs
Office space
Retail space and restaurants
Total Household Income
Demand for professional and
business support services
Demand for utility services:
electric, natural gas, and water
Maintenance and repair
construction
New supplier/vendor relations
created with manufacturers
Total of these 4 categories
Total
$1,112
$4,871
$11,587
$17,570
$11,145
$711
$272
$1,291
$13,419
�
6
Household Earnings (Labor Income)
The jobs created by the various components of the Coronado Canyons Building
will subsequently create new sources of household income. The household income for
the total jobs created by construction totals about $1.1 million. The household income
for the total jobs created by the operation of the office space is about $4.8 million, and
for the retail and restaurant space is about $11.6 million, for a total of about $17.6
million for this building. This income calculation comes from the RIMS II input-output
model, which measures the average income per job by industry. The model
calculations are based on the types of jobs that will be created within the regional
center, with indirect/induced impacts allocated based on the types of commodity inputs
required by the businesses that would potentially locate in the regional center.
Demand for Business Services, Utilities, Maintenance and Construction, and New
Supplier/Vendor Relationships Created with Manufacturers
The total economic impact of the regional center from the supplier purchases and
business relationships for the Coronado Canyons Building will create approximately
$13.4 million in additional economic activity across the region. These supplier
purchases are calculated from the indirect increase in output generated by the RIMS II
model. It should be noted that some of these supplier industries might potentially locate
within the regional center, and their economic output is included in this total.
The estimate of supplier purchases is based on the commodity data in the RIMS
II input-output model. This data specifies the amount and type of commodity input
needed to maintain specific types of business operations. The model estimates the
supplier purchases based on the types of jobs and number of jobs that will be created
within the regional center. In addition, the model allocates the supplier purchases to
businesses within the region, based on trade flow data from the U.S. Bureau of
Economic Analysis.
The regional center will create demand for business services including,
professional services, management of companies, and administration and waste
management services. The impact of this activity totals about $11.1 million annually.
Most of this represents the direct output of the office space in the building.
Utilities include services such as electricity, natural gas, and water and sewer
facilities. The economic impact on utility services totals about $0.7 million.
Maintenance and repair services include some building and construction activity
on existing buildings. The regional center would create an economic impact of about
$0.3 million within these sectors in the region. This figure is in addition to the $4.43
million in renovation construction that will be undertaken before the building is occupied.
�
7
New supplier/vendor relationships with manufacturers would create an economic
impact of $1.3 million. Most of this represents the purchases of locally manufactured
goods used in construction.
3. Introduction and Scope of Work
Nevada California Regional Center, LLC plans to purchase a currently vacant
mixed use commercial building located at 650 S. Green Valley Pkwy., Henderson, NV
89052, which is in Clark County. The building consists of four units, with first-floor retail
space of about 74,760 square feet and second-floor office space of approximately
13,800 square feet. The building is located within the Green Valley Ranch master
planned community, with close access to the Green Valley Corporate Center, Green
Valley Ranch Resort and Casino, the District, and St. Rose Hospital.
Section (4) contains a brief discussion of the RIMS II model. Section (5) presents
the data for the principal economic parameters for this region for Clark County,
compared to the statistics for the state of Nevada and the overall U. S. economy.
Section (6) shows the location of Clark County area and explains why no other counties
are included in the multiplier analysis. It also describes the location of the Coronado
Canyons Building.
Section (7) discusses the construction expenditures for renovation, and presents
the economic impact of that activity. Results are shown for the increase in employment,
output, and earnings, and the average level of output and earnings per new worker, for
the 20 major industrial classifications calculated by the RIMS II model. Section (8)
discusses the employment and revenue effects that will occur from the operations of the
retail space and restaurants, and presents the economic impact tables for these
operations. Section (9) provides similar material for the office space. The combined
results for the entire project are summarized in Section (10).
�
8
4. Discussion of RIMS II Final Demand Methodology
The following material has been condensed from the RIMS II User Handbook
Introduction and General Comments
Effective planning for public- and private-sector projects and programs at the
State and local levels requires a systematic analysis of the economic impacts of these
projects and programs on affected regions. In turn, systematic analysis of economic
impacts must account for the inter-industry relationships within regions because these
relationships largely determine how regional economies are likely to respond to project
and program changes. Thus, regional input-output (I-O) multipliers, which account for
inter-industry relationships within regions, are useful tools for conducting regional
economic impact analysis.
In the 1970s, the Bureau of Economic Analysis (BEA) developed a method for
estimating regional I-O multipliers known as RIMS (Regional Industrial Multiplier
System), which was based on the work of Garnick and Drake. In the 1980s, BEA
completed an enhancement of RIMS, known as RIMS II (Regional Input-Output
Modeling System), and published a handbook for RIMS II users.
In 1992, BEA
published a second edition of the handbook in which the multipliers were based on
more recent data and improved methodology. In 1997, BEA published a third edition of
the handbook that provides more detail on the use of the multipliers and the data
sources and methods for estimating them.
RIMS II is based on an accounting framework called an I-O table. For each
industry, an I-O table shows the industrial distribution of inputs purchased and outputs
sold. A typical I-O table in RIMS II is derived mainly from two data sources: BEA's
national I-O table, which shows the input and output structure of nearly 500 U.S.
industries, and BEA's regional economic accounts, which are used to adjust the national
I-O table to show a region's industrial structure and trading patterns.
Using RIMS II for impact analysis has several advantages. RIMS II multipliers
can be estimated for any region composed of one or more counties and for any
industry, or group of industries, in the national I-O table. The accessibility of the main
data sources for RIMS II keeps the cost of estimating regional multipliers relatively low.
Empirical tests show that estimates based on relatively expensive surveys and RIMS IIbased estimates are similar in magnitude.
BEA's RIMS multipliers can be a cost-effective way for analysts to estimate the
economic impacts of changes in a regional economy. However, it is important to keep in
mind that, like all economic impact models, RIMS provides approximate order-ofmagnitude estimates of impacts. RIMS multipliers are best suited for estimating the
impacts of small changes on a regional economy. For some applications, users may
want to supplement RIMS estimates with information they gather from the region
undergoing the potential change. To use the multipliers for impact analysis effectively,
users must provide geographically and industrially detailed information on the initial
�
9
changes in output, earnings, or employment that are associated with the project or
program under study. The multipliers can then be used to estimate the total impact of
the project or program on regional output, earnings, and employment.
RIMS II is widely used in both the public and private sector. In the public sector,
for example, the Department of Defense uses RIMS II to estimate the regional impacts
of military base closings. State transportation departments use RIMS II to estimate the
regional impacts of airport construction and expansion. In the private-sector, analysts
and consultants use RIMS II to estimate the regional impacts of a variety of projects,
such as the development of shopping malls and sports stadiums.
RIMS II Methodology
RIMS II uses BEA's benchmark and annual I-O tables for the nation. Since a
particular region may not contain all the industries found at the national level, some
direct input requirements cannot be supplied by that region's industries. Input
requirements that are not produced in a study region are identified using BEA's regional
economic accounts.
The RIMS II method for estimating regional I-O multipliers can be viewed as a
three-step process. In the first step, the producer portion of the national I-O table is
made region-specific by using six-digit NAICS location quotients (LQs). The LQs
estimate the extent to which input requirements are supplied by firms within the region.
RIMS II uses LQs based on two types of data: BEA's personal income data (by place of
residence) are used to calculate LQs in the service industries; and BEA's wage-andsalary data (by place of work) are used to calculate LQs in the non-service industries.
In the second step, the household row and the household column from the
national I-O table are made region-specific. The household row coefficients, which are
derived from the value-added row of the national I-O table, are adjusted to reflect
regional earnings leakages resulting from individuals working in the region but residing
outside the region. The household column coefficients, which are based on the personal
consumption expenditure column of the national I-O table, are adjusted to account for
regional consumption leakages stemming from personal taxes and savings. In the last
step, the Leontief inversion approach is used to estimate multipliers. This inversion
approach produces output, earnings, and employment multipliers, which can be used to
trace the impacts of changes in final demand on and indirectly affected industries.
Advantages of RIMS II
There are numerous advantages to using RIMS II. First, the accessibility of the
main data sources makes it possible to estimate regional multipliers without conducting
relatively expensive surveys. Second, the level of industrial detail used in RIMS II helps
avoid aggregation errors, which often occur when industries are combined. Third, RIMS
II multipliers can be compared across areas because they are based on a consistent set
�
10
of estimating procedures nationwide. Fourth, RIMS II multipliers are updated to reflect
the most recent local-area wage-and-salary and personal income data.
Overview of Different Multipliers
RIMS II provides users with five types of multipliers: final demand multipliers for
output, for earnings, and for employment; and direct-effect multipliers for earnings and
for employment. These multipliers measure the economic impact of a change in final
demand, in earnings, or in employment on a region’s economy.
The final demand multipliers for output are the basic multipliers from which all
other RIMS II multipliers are derived. In this table, each column entry indicates the
change in output in each row industry that results from a $1 change in final demand in
the column industry. The impact on each row industry is calculated by multiplying the
final demand change in the column industry by the multiplier for each row. The total
impact on regional output is calculated by multiplying the final demand change in the
column industry by the sum of all the multipliers for each row except the household row.
RIMS II provides two types of multipliers for estimating the impacts of changes
on earnings: final demand multipliers and direct effect multipliers. These multipliers are
derived from the table of final demand output multipliers.
The final demand multipliers for earnings can be used if data on final demand
changes are available. In the final demand earnings multiplier table, each column entry
indicates the change in earnings in each row industry that results from a $1 change in
final demand in the column industry. The impact on each row industry is calculated by
multiplying the final demand change in the column industry by the multipliers for each
row. The total impact on regional earnings is calculated by multiplying the final demand
change in the column industry by the sum of the multipliers for each row.
Employment Multipliers
RIMS II provides two types of multipliers for estimating the impacts of changes
on employment: final demand multipliers and direct effect multipliers. These multipliers
are derived from the table of final demand output multipliers.
The final demand multipliers for employment can be used if the data on final
demand changes are available. In the final demand employment multiplier table, each
column entry indicates the change in employment in each row industry that results from
a $1 million change in final demand in the column industry. The impact on each row
industry is calculated by multiplying the final demand change in the column industry by
the multiplier for each row. The total impact on regional employment is calculated by
multiplying the final demand change in the column industry by the sum of the multipliers
for each row.
�
11
The direct effect multipliers for employment can be used if the data on the initial
changes in employment by industry are available. In the direct effect employment
multiplier table, each entry indicates the total change in employment in the region that
results from a change of one job in the row industry. The total impact on regional
employment is calculated by multiplying the initial change in employment in the row
industry by the multiplier for the row.
Choosing a Multiplier
The choice of multiplier for estimating the impact of a project on output, earnings,
and employment depends on the availability of estimates of the initial changes in final
demand, earnings, and employment. If the estimates of the initial changes in all three
measures are available, the RIMS II user can select any of the RIMS II multipliers. In
theory, all the impact estimates should be consistent. If the available estimates are
limited to initial changes in final demand, the user can select a final demand multiplier
for impact estimation. If the available estimates are limited to initial changes in earnings
or employment, the user can select a direct effect multiplier.
�
12
5. Economic Parameters for Clark County
This section is organized as follows. Table 5-1 shows the key economic
parameters for Clark County and compares then with Nevada and the U.S. Table 5-2
show the labor force, employment, and unemployment statistics for Las Vegas, Clark
County, and Nevada from 2000 through 2010.
Table 5-1. Comparison of Clark County, Nevada, and the U.S.
Category
EMPLOYMENT STATUS
Population 16 years and over
In labor force
Civilian labor force
Employed
Unemployed
Armed Forces
Not in labor force
OCCUPATION
Civilian employed population 16 +
Management & professional
Service occupations
Sales and office occupations
Farming, fishing, & forestry
Construction, maintenance, repair
Production & transportation
INDUSTRY
Civilian employed population 16 +
Agriculture & mining
Construction
Manufacturing
Wholesale trade
Retail trade
Transportation & utilities
Information
Finance, insurance & real estate
Professional & administrative
Educational services & health care
Arts, entertainment, hotel, food
svcs
Other private services
Clark
County NV
Nevada
1,423,938
998,060
989,412
917,302
72,110
8,648
425,878
100.0%
70.1%
69.5%
64.4%
5.1%
0.6%
29.9%
2,003,468
1,384,364
1,374,480
1,273,822
100,658
9,884
619,104
100.0%
69.1%
68.6%
63.6%
5.0%
0.5%
30.9%
United
States
238,764,455
157,465,113
156,225,077
146,266,253
9,958,824
1,240,036
81,299,342
%
917,302
243,258
250,434
235,890
630
105,465
81,625
100.0%
26.5%
27.3%
25.7%
0.1%
11.5%
8.9%
1,273,822
347,001
326,054
329,307
3,019
148,914
119,527
100.0%
27.2%
25.6%
25.9%
0.2%
11.7%
9.4%
146,266,253
51,064,301
25,084,498
37,252,708
997,997
13,612,976
18,253,773
100.0%
34.9%
17.1%
25.5%
0.7%
9.3%
12.5%
917,302
2,115
96,842
31,928
18,307
103,556
42,821
15,963
62,592
96,545
115,676
100.0%
0.2%
10.6%
3.5%
2.0%
11.3%
4.7%
1.7%
6.8%
10.5%
12.6%
1,273,822
20,152
132,098
57,897
28,004
151,241
62,421
21,560
81,270
128,205
170,598
100.0%
1.6%
10.4%
4.5%
2.2%
11.9%
4.9%
1.7%
6.4%
10.1%
13.4%
146,266,253
2,653,081
10,777,675
16,381,624
4,383,802
16,994,717
7,595,843
3,527,777
10,112,239
15,242,426
31,757,530
100.0%
1.8%
7.4%
11.2%
3.0%
11.6%
5.2%
2.4%
6.9%
10.4%
21.7%
257,223
39,040
28.0%
4.3%
309,995
51,654
24.3%
4.1%
12,904,517
7,092,352
8.8%
4.8%
100.0%
65.9%
65.4%
61.3%
4.2%
0.5%
34.1%
�
13
Public administration
34,694
3.8%
58,727
4.6%
6,842,670
4.7%
INCOME AND BENEFITS
Total households
Less than $10,000
$10,000 to $14,999
$15,000 to $24,999
$25,000 to $34,999
$35,000 to $49,999
$50,000 to $74,999
$75,000 to $99,999
$100,000 to $149,999
$150,000 to $199,999
$200,000 or more
Median household income (dollars)
Mean household income (dollars)
684,605
35,790
25,892
58,746
68,720
107,273
144,646
99,108
90,548
29,599
24,283
56,696
72,696
100.0%
5.2%
3.8%
8.6%
10.0%
15.7%
21.1%
14.5%
13.2%
4.3%
3.5%
109.0%
101.7%
952,856
52,212
36,982
86,534
95,560
143,748
202,151
137,512
127,347
38,334
32,476
56,361
72,233
100.0%
5.5%
3.9%
9.1%
10.0%
15.1%
21.2%
14.4%
13.4%
4.0%
3.4%
108.3%
101.0%
113,101,329
8,149,557
6,141,047
12,049,123
11,718,207
16,028,909
21,251,695
14,015,215
13,921,120
4,954,443
4,872,013
52,029
71,498
100.0%
7.2%
5.4%
10.7%
10.4%
14.2%
18.8%
12.4%
12.3%
4.4%
4.3%
Families
Less than $10,000
$10,000 to $14,999
$15,000 to $24,999
$25,000 to $34,999
$35,000 to $49,999
$50,000 to $74,999
$75,000 to $99,999
$100,000 to $149,999
$150,000 to $199,999
$200,000 or more
Median family income (dollars)
Mean family income (dollars)
Per capita income (dollars)
440,732
14,053
9,470
30,023
40,261
67,329
96,484
71,269
69,466
22,957
19,420
64,255
81,802
27,383
100.0%
3.2%
2.1%
6.8%
9.1%
15.3%
21.9%
16.2%
15.8%
5.2%
4.4%
101.4%
98.1%
99.3%
615,019
21,484
13,614
43,042
53,409
88,860
136,737
101,857
99,278
30,253
26,485
64,910
81,931
27,421
100.0%
3.5%
2.2%
7.0%
8.7%
14.4%
22.2%
16.6%
16.1%
4.9%
4.3%
102.4%
98.3%
99.4%
75,030,551
3,211,198
2,404,943
6,148,998
6,827,538
10,239,597
15,144,495
11,047,974
11,568,389
4,251,923
4,185,496
63,366
83,351
27,589
100.0%
4.3%
3.2%
8.2%
9.1%
13.6%
20.2%
14.7%
15.4%
5.7%
5.6%
Median earnings for workers
Median earnings for male full-time
Median earnings for female fulltime
31,605
43,643
105.8%
95.8%
31,241
45,178
104.6%
99.2%
29,868
45,556
34,875
98.3%
34,724
97.9%
35,471
7.6%
10.8%
78.4%
81.8%
7.9%
11.3%
81.4%
85.6%
9.7%
13.2%
PERCENTAGE BELOW POVERTY
All families
All people
Note: in this table, the percentage figures in black are proportions of the total in that category, while
the percentage figures in red are relative to the U.S. figures.
�
14
The occupational figures for Clark County show a larger than average proportion
of employees in construction, with 10.6% of the workforce in that industry compared to
7.4% nationally, although that figure may diminish as the housing slump continues. The
county has a very small manufacturing base -- 3.5% compared to 11.2% nationally. Of
course the huge difference occurs in tourism – leisure time activities, hotels, and
restaurants – with a whopping 28.0% of the workforce engaged in that sector, compared
to 8.8% nationally. As a result, there are relatively fewer people employed in virtually all
other sectors, with the biggest decrement in education and health care, with only 12.6%
of the workforce employed there, compared to 21.7% nationally.
In spite of the marketing slogan that “What happens in Vegas, stays in Vegas”,
the city is not particularly wealthy; only 3.5% of the households have incomes of over
$200,000 per year, compared to 4.3% nationally. However, there are also relatively few
poor people, so median household income is 109% of the national average. Family
income is only 101% of the national average, as many of the relatively affluent
households are not families as defined by the Census. The poverty levels are well
below average, and are about 2 percentage points below the U. S. figures.
Table 5-2. Key Labor Market Statistics, Clark County, Las Vegas, and Nevada,
2000-2010
Labor Force
Employed
Unemployed
Un Rate, %
2000
2001
2002
2003
2004
2005
2006
2007
2008
2009
2010
Clark County
727521
759562
783659
806062
830951
872410
911492
934560
960679
971430
969098
693933
717631
737301
762771
793908
833717
873249
891813
896809
847668
821597
33588
41931
46358
43291
37043
38693
38243
42747
63870
123762
147501
4.6
5.5
5.9
5.4
4.5
4.4
4.2
4.6
6.6
12.7
15.2
2000
2001
2002
2003
2004
2005
2006
Las Vegas
245183
256125
264315
271780
280014
269094
274709
233195
241159
247769
256328
266792
257161
262958
11988
14966
16546
15452
13222
11933
11751
4.9
5.8
6.3
5.7
4.7
4.4
4.3
�
15
2007
2008
2009
2010
276023
279201
282262
281753
263020
260070
245079
237541
13003
19131
37183
44212
4.7
6.9
13.2
15.7
2000
2001
2002
2003
2004
2005
2006
2007
2008
2009
2010
State of Nevada
1062845
1101020
1130780
1153910
1180314
1228339
1276387
1307321
1336309
1354126
1350309
1015221
1042182
1066477
1093507
1128223
1173425
1222277
1247491
1246696
1184431
1149537
47624
58838
64303
60403
52091
54914
54110
59830
89613
169695
200772
4.5
5.3
5.7
5.2
4.4
4.5
4.2
4.6
6.7
12.5
14.9
Nevada has been harder hit by the recession than any other state, with the result
that the unemployment rate soared to 14.9% in 2010, meaning the entire state is a TEA.
The unemployment rate in Clark County was even higher, at 15.2%, while for the city of
Las Vegas the rate was 15.7%. There were more than 147,000 unemployed people in
Clark County in 2010.
6. Maps of Area and Location of Building
Figure 6-1 shows the map of Clark County, which is located at the southern tip of
Nevada, wedged in between California and Arizona. It is basically a self-contained
county; of the total reported workforce of 644,266 in 2000, 620,500 of those people
were residents of the county. That 96.3% is an unusually high percentage. As a result,
the multiplier estimates used throughout this report are based only on Clark County.
Figure 6-2 shows the map of Henderson, NV, and Figure 6-3 shows the location
of the Colorado Canyons building, which is at the southeast corner of S. Green Valley
Pkwy and W. Horizon Ridge Pkwy
�
16
Figure 6-1. Map of Clark County
Figure 6-2. Map of Henderson, NV
�
17
Figure 6-3. Location of Colorado Canyons Building
7. Economic Impact of Construction Expenditures for Renovation
According to the developer, about $50 per square foot will be spent to renovate
the building, so for a total of 88,560 square feet, that would be about $4.43 million.
Even if the construction project takes less than two years, the indirect and
induced jobs can be counted. On January 16, 2009, James W. McCament, Chief of
USCIS, wrote a letter to Senator John Cornyn, which contained the following language:
Indirect and induced jobs created as a result of construction jobs whether counted or not may be
included in the job count. Even when the construction jobs may not be counted towards the job
creation requirement, they do have indirect and induced impacts that are eligible to be included in the
final job count because they are "continuous, permanent employment."
The economic argument behind this logic may be summarized as follows.
Consider a tax cut that is temporary (perhaps a rebate). It clearly provides some
initial stimulus, but then it is not repeated. Nonetheless, the overall state of the
�
18
economy has improved; no one argues that real GDP drops back to its previous level
once the rebate expires. Instead, the temporary stimulus has boosted overall demand;
during the time of the rebate, money was spent, people were hired, and those benefits
continued after the rebate period had passed.
In this light, we can also look at a stimulus program (perhaps public works) which
would be even more appropriate considering we are analyzing temporary investment.
Public funds are expended for various projects over (say) one year, and when the
projects are completed, the stimulus is not repeated. However, the economy is clearly
better off because that stimulus has in fact created jobs, caused new workers to spend
their paychecks, etc., which has a multiplier (or ripple) effect throughout the economy
that does not disappear even after the public works funds have been expired. In fact, in
the case of public works projects such as highways, railroads, utilities, etc. the argument
is also made that the productive capacity of the economy has been increased, so the
economy benefits from a supply-side as well as a demand-side stimulus. To the extent
that overall capacity has increased, the economy is able to produce more as it gradually
returns to a position of full employment.
Tables 7-1 and 7-2 show the economic impact of the construction activity for
renovating the building.
Table 7-1. Increase in Employment, Output, and Earnings, $4.43 Million in
Construction Expenditures, Indirect and Induced Jobs Only
Industry Group
Agriculture, forestry, fishing,
Mining
Utilities
Construction
Manufacturing
Wholesale trade
Retail trade
Transportation and warehousing
Information
Finance and insurance
Real estate and rental and leasing
Professional and scientific services
Management of companies
Admin and waste mgmt services
Educational services
Health care and social assistance
Arts, entertainment, and recreation
Accommodation
Food services and drinking places
Other services
Employment
0.0
0.1
0.2
0.3
2.3
1.1
7.1
1.3
0.6
1.3
2.7
3.4
0.3
2.5
0.5
3.0
0.6
0.5
2.4
1.7
Output
0
20
81
31
428
188
518
137
144
260
624
436
89
128
28
282
40
48
130
162
Earnings
0
5
15
12
97
59
181
51
31
66
50
190
37
53
11
135
13
14
41
50
�
19
Household
Total
0.4
0
4
32.2
3774
1112
Table 7-1 shows there would be a total of 32 indirect and induced new jobs
created by this activity, with an increase in output of about $3.8 million, and an increase
in labor income of $1.1 million. Table 7-2 shows that the average output per new
worker would be about $117,200, and average annual earnings would be about
$34,500.
Table 7-2. Output, and Earnings, $4.43 Million in Construction Expenditures,
Indirect and Induced Jobs Only
Industry Group
Agriculture, forestry, fishing,
Mining
Utilities
Construction
Manufacturing
Wholesale trade
Retail trade
Transportation and warehousing
Information
Finance and insurance
Real estate and rental and leasing
Professional and scientific services
Management of companies
Admin and waste mgmt services
Educational services
Health care and social assistance
Arts, entertainment, and recreation
Accommodation
Food services and drinking places
Other services
Household
Total
Employment
0.0
0.1
0.2
0.3
2.3
1.1
7.1
1.3
0.6
1.3
2.7
3.4
0.3
2.5
0.5
3.0
0.6
0.5
2.4
1.7
0.4
Output/Empl
142.9
189.3
516.9
118.7
189.5
177.2
73.3
104.0
223.8
206.8
227.4
129.5
272.4
50.3
57.1
94.1
61.4
105.1
53.3
95.5
0.0
Earnings/Empl
0.0
49.4
96.0
45.4
42.7
56.0
25.5
38.4
47.5
52.2
18.1
56.4
112.5
20.8
21.8
45.1
20.5
31.1
16.9
29.2
9.7
32.2
117.2
34.5
�
20
8. Discussion of Revenue and Employment, and Economic Impact,
for Retail Space and Restaurants
The methodology used for determining the economic impact of retail jobs is as
follows.
First, the national figures for sales per square foot for 16 different categories of retail
chain stores are taken from the 2009 Bizminer survey, as shown in Table 8-1.
Second, these figures are adjusted for sales per square foot in Clark County.
Third, these figures are multiplied by the projected number of square feet for each type
of retail establishment, which provides revenue estimates. These are also shown in
Table 8-1 for retail stores, and are estimated to be 70,000 square feet of stores plus
4,760 square feet for the restaurant, for a total of 74,760 square feet of retail space.
Fourth, the retail sales (but not restaurant) figures are converted from sales to value
added by multiplying by the average retail margin of 0.45; that step is necessary
because in all input/output models, the trade sector figures for “output” are actually
value added.
Fifth, the value added figures for retail sales are multiplied by the RIMS II final demand
multiplier of 19.93 for retail sales in Clark County, and the sales figures for restaurants
are multiplied by 25.075. Those results are shown in Tables 8-3 and 8-4.
Table 8-1. Calculation of Retail Sales for Coronado Canyons Building
Category
Auto parts, accessories
Furniture, home furnishings
Electronics and appliances
Bldg materials
Food and beverage
Pharmacies
Clothing stores
Shoe stores
Jewelry, luggage
Sporting goods, hobby
Books, magazines
General merchandise
Misc stores
Total
Key to Table 8-1.
sal/emp
Natl
151.9
191.6
224.1
239.6
190.2
247.6
123.9
127.1
191.4
135.5
119.3
208.9
131.1
sal/emp
Clark
157.6
239.8
227
233.9
191.6
182
162.9
294.8
148.6
161.2
228.6
182.9
144.8
Ratio
1.038
1.07
1.194
0.976
0.874
1.389
1.282
1.541
1.136
1.35
1.094
1.07
1.104
Sales/sf
Natl
198
243
769
281
559
911
329
354
783
234
238
548
175
Sales/sf
Clark
206
260
918
274
489
1265
422
546
889
316
260
586
193
Square
Feet
Sales
Mil $
10
9.2
10
5
10
5
5
5
4.9
6.3
4.2
2.7
4.4
1.6
10
10
5.9
1.9
70
41.1
�
21
Sal/emp, Natl = sales per employee, national, $000s, 2007 Economic Census
Sal/emp, Clark= sales per employee, Clark County, $000s, 2007 Economic Census
Ratio = Col (2)/Col (1)
Sales/sf, Natl = sales per square foot from 2009 Bizminer survey
Sales/sf, Clark = sales per square foot for Clark County equals national * ratio
Square Feet = assumed square feet for each type of sales in Spring Mountain building
Sales = square feet times sales/sf for Clark County, Mil $
The sales per square foot for restaurants are based on data taken from the Retail
Traffic Magazine website and shown in Table 8-2. According to these figures,
restaurant sales for major chains average about $550 per square foot.
Table 8-2. Sales of Restaurants by Major Chain
Chain
Cheesecake Factory
P.F. Chang's
Cracker Barrel
Olive Garden
Red Lobster
Outback Steakhouse
Macaroni Grill
Carraba's
Joe's Crab Shack
Chili's
California Pizza Kitchen
Red Robin
O'Charley's
Longhorn Steakhouse
Applebee's
Ruby Tuesday
Average
Units
76
90
484
532
680
665
198
133
138
711
135
110
206
180
372
449
Average
Annual
Sq. Ft.
Seats
($millions)
11,000
340
$11
6,700
215
$5.70
10,000
187
$4.10
8,000
235
$3.90
6,600
190
$3.70
6,200
247
$3.40
7,100
265
$3.30
6,650
255
$3.10
8,000
215
$3.10
5,400
210
$3
5,000
150
$2.90
6,400
200
$2.90
6,750
255
$2.80
5,100
190
$2.60
4,850
185
$2.20
5,100
205
$2.20
108,850
60
Sales
$1,000
$851
$410
$488
$561
$548
$465
$466
$388
$556
$580
$453
$415
$510
$454
$431
$550
The retail sales revenue of $41.1 million, and the restaurant sales of $2.6 million,
are entered in the RIMS II model, and the results are shown in the next two tables.
Table 8-3. Increase in Employment, Output, and Earnings for $41.1 Million of
�
22
Retail Sales ($18.5 Million of Value Added) and $2.6 Million of Restaurant Sales
Industry Group
Agriculture, forestry, fishing,
Mining
Utilities
Construction
Manufacturing
Wholesale trade
Retail trade
Transportation and warehousing
Information
Finance and insurance
Real estate and rental and leasing
Professional and scientific services
Management of companies
Admin and waste mgmt services
Educational services
Health care and social assistance
Arts, entertainment, and recreation
Accommodation
Food services and drinking places
Other services
Household
Total
Employment
0.0
0.0
1.0
1.6
3.6
3.4
270.6
9.2
4.2
6.2
21.1
9.2
2.2
14.3
2.2
12.3
3.5
1.8
59.4
6.5
1.5
Output
2
2
508
187
663
604
19819
853
852
1286
3468
1022
592
744
130
1154
214
188
3173
635
0
Earnings
0
0
98
72
145
192
6912
357
207
327
310
482
244
300
50
553
70
57
1005
192
15
433.7
36096
11587
Table 8-3 shows that the operations from the retail stores and restaurants would
create a total of 434 new jobs, with an increase in output of about $36.1 million, and an
increase in household earnings of about $11.6 million.
Table 8-4 shows that the
average output (value added) per retail sales employee is about $73,200, and average
annual earnings are about $25,500. For restaurants, the comparable figures are
$53,400 for output and $16,900 for earnings; the latter figure excludes most tips. For all
new workers, the comparable figures are $83,200 for output per worker and $26,700 for
average annual earnings.
Table 8-4. Output and Earnings per New Worker for $41.1 Million of Retail Sales
�
23
and $2.6 Million of Restaurant Sales
Industry Group
Agriculture, forestry, fishing,
Mining
Utilities
Construction
Manufacturing
Wholesale trade
Retail trade
Transportation and warehousing
Information
Finance and insurance
Real estate and rental and leasing
Professional and scientific services
Management of companies
Admin and waste mgmt services
Educational services
Health care and social assistance
Arts, entertainment, and recreation
Accommodation
Food services and drinking places
Other services
Household
Total
Employment
0.0
0.0
1.0
1.6
3.6
3.4
270.6
9.2
4.2
6.2
21.1
9.2
2.2
14.3
2.2
12.3
3.5
1.8
59.4
6.5
1.5
Output/Empl
112.7
176.3
499.6
119.1
186.1
177.0
73.2
93.2
202.7
208.0
164.2
111.5
272.2
52.2
58.6
94.0
60.5
104.9
53.4
97.7
0.0
Earnings/Empl
0.0
0.0
96.7
45.9
40.7
56.2
25.5
39.0
49.2
52.9
14.7
52.6
112.2
21.0
22.4
45.0
19.7
31.5
16.9
29.6
9.8
433.7
83.2
26.7
9. Discussion of Revenue and Employment, and Economic Impact,
for Office Space
We start this section by estimating the number of direct employees per square
foot. The number of lawyers and similar professions per square foot for office buildings
can be taken from data supply by the U.S. Energy Information Agency. As part of its
comprehensive study on energy use, the Energy Information Agency prepares annual
estimates on the amount of energy used by type and size of commercial building. This
study also estimates the number of mean square feet per worker by type of building.
Their figure for office buildings, 434 square feet per worker, is used in this study. The
complete table from the EIA study is given below, in Table 9-1.
Table 9-1. Estimates of Square Feet per Worker by Type of Building
�
24
All
Buildings*................................
Building Floorspace
(Square Feet)
1,001
to
................................
5,001
to
..............................
10,001
to
............................
25,001
to
............................
50,001
to
..........................
100,001
to
........................
200,001
to
........................
Over
.................................
Number of
Buildings
(thousand)
Total
Floorspace
(million
square
feet)
Total
Workers
in
All
Buildings
(thousand)
Mean
Square
Feet
per
Building
(thousand)
Mean
Square
Feet per
Worker
Mean
Hours
per Week
4,645
64,783
72,807
13.9
890
61
2,552
6,789
9,936
2.7
683
57
889
6,585
7,512
7.4
877
61
738
11,535
10,787
15.6
1,069
67
241
8,668
8,881
35.9
976
72
129
9,057
8,432
70.4
1,074
80
65
9,064
11,632
138.8
779
89
25
7,176
6,883
289.0
1,043
100
7
5,908
8,744
896.1
676
115
386
9,874
12,489
25.6
791
50
226
1,255
1,430
5.6
877
107
297
1,654
3,129
5.6
528
86
129
3,163
6,317
24.6
501
59
8
1,905
3,716
241.4
513
168
121
1,258
2,600
10.4
484
52
142
5,096
2,457
35.8
2,074
167
443
4,317
3,463
9.7
1,246
59
824
12,208
28,154
14.8
434
55
277
3,939
2,395
14.2
1,645
50
71
1,090
1,347
15.5
809
103
370
3,754
1,706
10.1
2,200
32
622
4,050
3,667
6.5
1,105
55
597
10,078
4,369
16.9
2,306
66
79
1,738
1,819
21.9
956
63
5,000
10,000
25,000
50,000
100,000
200,000
500,000
500,000
Principal Building Activity
Education
.......................................
Food
Sales
.....................................
Food
Service
.................................
Health
Care
....................................
Inpatient
.......................................
Outpatient
....................................
Lodging
..........................................
Retail
(Other
Than
Mall)..................
Office
.............................................
Public
Assembly
............................
Public
Order
and
Safety
................
Religious
Worship
..........................
Service
..........................................
Warehouse
and
Storage
...............
Other
..............................................
However, an additional adjustment should be made. The 434 square feet per
person assumes that the professionals in those offices need space for customer
�
25
accommodations, which is indeed the case for lawyers and other professions such as
advertising executives or public relations firms. However, for other types of businesses,
the number of square feet per employee is substantially smaller, and the number of
employees larger, since it is not necessary to have reception areas, conference rooms,
and other similar amenities for customers.
For example, data available on 10 web sites of companies who specialize in
research and development reveals the following number of square feet per employee:
250, 215, 219, 230, 250, 200, 200, 300, 300 and 250 -- for an average of 245 square
feet per employee. Hence a 100,000 square foot office building housing those types of
businesses would have 408 employees, or 77% more than the example given above.
In terms of office staffing and space requirements for computer programmers, the
layout would probably be similar to a company such as Amazon or Google. Amazon
states that it allocates 180 to 250 square feet per programming employee, although the
higher number is reserved for senior level personnel. Google states that it allocates
150 to 200 square feet per programming employee. Other similar office arrangements,
based on Internet data, also show figures of 150 to 200 square feet per employee.
In terms of other professional offices, it is assumed that the average number of
space per employee will be midway between the 250 square foot figure for civic
organizations and the 434 square foot figure for lawyers and accountants, or 342
square feet per employee. That provides room for some conference and meeting
rooms, but less space for luxurious lobbies and reception areas. That is the figure
used in this study.
Since the type of tenants that would occupy this office building is not yet known,
we use a combination of six different types of professions, as shown below in Table 9-1.
For the calculations in this table, it is assumed that the 434 sq ft/employee figures
applies to lawyers and advertising/public relationship, the 342 sq ft/employee figure
applies to architects/engineers and consultants, and the 250 sq ft/employee figure
applies to accountants/tax preparers and computer system and design services. The
total amount of office space is 13,800 square feet, and is assumed to be divided equally
among the six professions, which is 2,300 square feet for each type of profession given
below in Table 9-2.
Table 9-2. Estimate of Job Creation for Office Space
direct
Category
Offices of lawyers
Accounting, tax preparation, bookkeeping, and
payroll services
Architectural, engineering, and related services
Computer systems design services
Consultants
total
Rev/e
175.3
FD
mult
15.51
e/sqft
434
jobs
5.3
rev
0.93
Jobs
14.4
85.4
197
163.7
159.2
19.99
14.37
16.87
16.58
250
342
250
342
9.2
6.7
9.2
6.7
0.79
1.32
1.51
1.07
15.7
19.0
25.4
17.8
�
26
Advertising, public relations, and related services
257.3
16.54
434
Total Office
5.3
1.36
22.6
42.4
6.98
114.9
Key to Table 9-2.
Rev/e, revenue per employees, Clark County, 2007 Economic Census, $000/yr
FD mult = RIMS II Final Demand multiplier for Clark County
e/sq ft = employees per 1000 sq ft, see previous table and associated commentary
empl = employees, calculated as 2,300 sq ft divided by previous column
rev = revenue, equals employees times revenue/employee, millions of $
jobs = RIMS II final demand multiplier times revenue
All figures are calculated from unrounded numbers
Table 9-3 and 9-4 show the economic impact of operations in 13,800 square feet
of office space.
Table 9-3. Increase in Employment, Output, and Earnings for 13,800 Square Feet
of Professional Office Space
Industry Group
Agriculture, forestry, fishing,
Mining
Utilities
Construction
Manufacturing
Wholesale trade
Retail trade
Transportation and warehousing
Information
Finance and insurance
Real estate and rental and leasing
Professional and scientific services
Management of companies
Admin and waste mgmt services
Educational services
Health care and social assistance
Arts, entertainment, and recreation
Accommodation
Food services and drinking places
Other services
Household
Total
Employment
0.0
0.0
0.2
0.5
1.1
1.0
7.2
2.5
1.8
2.4
6.2
66.7
0.7
6.9
0.9
5.2
1.8
1.2
5.7
2.5
0.6
Output
1
1
122
55
199
172
528
242
355
501
1186
7620
186
329
49
485
116
128
305
245
Earnings
0
0
23
21
46
55
184
97
78
128
94
3425
77
142
19
232
37
38
96
73
6
115.0
12824
4871
�
27
Table 9-3 shows that the operations of the office space would create 115 new
jobs. The increase in output would be about $12.8 million, and the increase in
household earnings would be about $4.9 million. Table 9-4 shows that the average
output per new worker would be about $115,000, and average annual earnings would
be about $42,300.
Table 9-4. Output and Earnings Per New Worker for 13,800 Square Feet of
Professional Office Space
Industry Group
Agriculture, forestry, fishing,
Mining
Utilities
Construction
Manufacturing
Wholesale trade
Retail trade
Transportation and warehousing
Information
Finance and insurance
Real estate and rental and leasing
Professional and scientific services
Management of companies
Admin and waste mgmt services
Educational services
Health care and social assistance
Arts, entertainment, and recreation
Accommodation
Food services and drinking places
Other services
Household
Total
Employment
0.0
0.0
0.2
0.5
1.1
1.0
7.2
2.5
1.8
2.4
6.2
66.7
0.7
6.9
0.9
5.2
1.8
1.2
5.7
2.5
0.6
Output/Empl
157.5
150.7
511.1
118.7
183.1
177.0
73.2
95.9
203.0
207.1
192.5
114.3
272.0
47.3
57.4
94.0
63.3
105.4
53.4
98.1
0.0
Earnings/Empl
0.0
24.0
95.9
45.2
42.0
56.2
25.5
38.4
44.7
52.8
15.2
51.4
112.4
20.4
22.4
45.0
20.3
31.4
16.9
29.3
10.2
115.0
111.5
42.3
�
28
10. Summary Statistics for Entire Project
The figures shown in Tables 10-1 and 10-2 are the summary of the tables
presented in Sections (7), (8), and (9) and hence are shown for ease of exposition.
Table 10-1. Increase in Employment, Output, and Earnings, Renovation and
Operation of Colorado Canyons Building
Industry Group
Agriculture, forestry, fishing,
Mining
Utilities
Construction
Manufacturing
Wholesale trade
Retail trade
Transportation and warehousing
Information
Finance and insurance
Real estate and rental and leasing
Professional and scientific services
Management of companies
Admin and waste mgmt services
Educational services
Health care and social assistance
Arts, entertainment, and recreation
Accommodation
Food services and drinking places
Other services
Household
Total
Employment
0.0
0.1
1.4
2.3
6.9
5.4
284.9
13.0
6.6
9.9
30.0
79.2
3.2
23.8
3.6
20.4
6.0
3.5
67.5
10.7
2.5
Output
3
24
711
272
1291
964
20865
1231
1351
2047
5278
9078
867
1200
207
1921
370
365
3608
1043
0
Earnings
0
5
136
105
287
306
7277
504
316
520
453
4097
358
495
80
920
120
109
1143
315
25
581.0
52695
17570
Table 10-1 shows there will be a total of 581 new jobs created from the
renovation and operations of the Coronado Canyons building. The increase in output
will be about $52.7 million, and the increase in household earnings will be about $17.6
million. Table 10-2 shows that the average output per new workers will be about
$90,700, and average annual earnings will be about $30,200.
�
29
Table 10-2. Output and Earnings Per New Worker, Renovation and Operation of
Colorado Canyons Building
Industry Group
Agriculture, forestry, fishing,
Mining
Utilities
Construction
Manufacturing
Wholesale trade
Retail trade
Transportation and warehousing
Information
Finance and insurance
Real estate and rental and leasing
Professional and scientific services
Management of companies
Admin and waste mgmt services
Educational services
Health care and social assistance
Arts, entertainment, and recreation
Accommodation
Food services and drinking places
Other services
Household
Total
Employment
0.0
0.1
1.4
2.3
6.9
5.4
284.9
13.0
6.6
9.9
30.0
79.2
3.2
23.8
3.6
20.4
6.0
3.5
67.5
10.7
2.5
Output/Empl
123.8
186.2
503.5
118.9
186.7
177.0
73.2
94.8
204.8
207.6
175.8
114.6
272.1
50.5
58.1
94.0
61.5
105.1
53.4
97.5
0.0
Earnings/Empl
0.0
43.0
96.5
45.7
41.6
56.1
25.5
38.8
47.8
52.8
15.1
51.7
112.3
20.8
22.3
45.0
20.0
31.4
16.9
29.5
9.9
581.0
90.7
30.2
�
 Historical archive . public document