PD RTFØR M U LAS
FORMULAIC TRENDING MONEY MANAGER
February 6, 2012:
~ ,-r’ “~
~7~Q..A_?72) t’Y
Overall RAM® Score =(~i-0.83J
RAM® Score is a proprietary “market-trending” tool that takes into account several dynamic components related to the U.S. markets and economy. It features a
core baseline which allows for correlation between these multiple components so that they may be added together for an overall Ram Score. As a market
trending tool, we believe that a positive RAM® Score indicates that the odds are stacked in favor of equity investments and a negative RAM® Score indicates that
odds are stacked against equity investments. Obviously, this does not guarantee that the market will increase when the score is positive or decrease when the
score is negative, but we believe the long term correlation may be a powerful tool for investing... Combining our trending features of RAM® Score with our
Portformulas® intricate Formulaic Investing” Strategies results in a uniquely logical approach to investing that is exclusively available through Portformulas®.
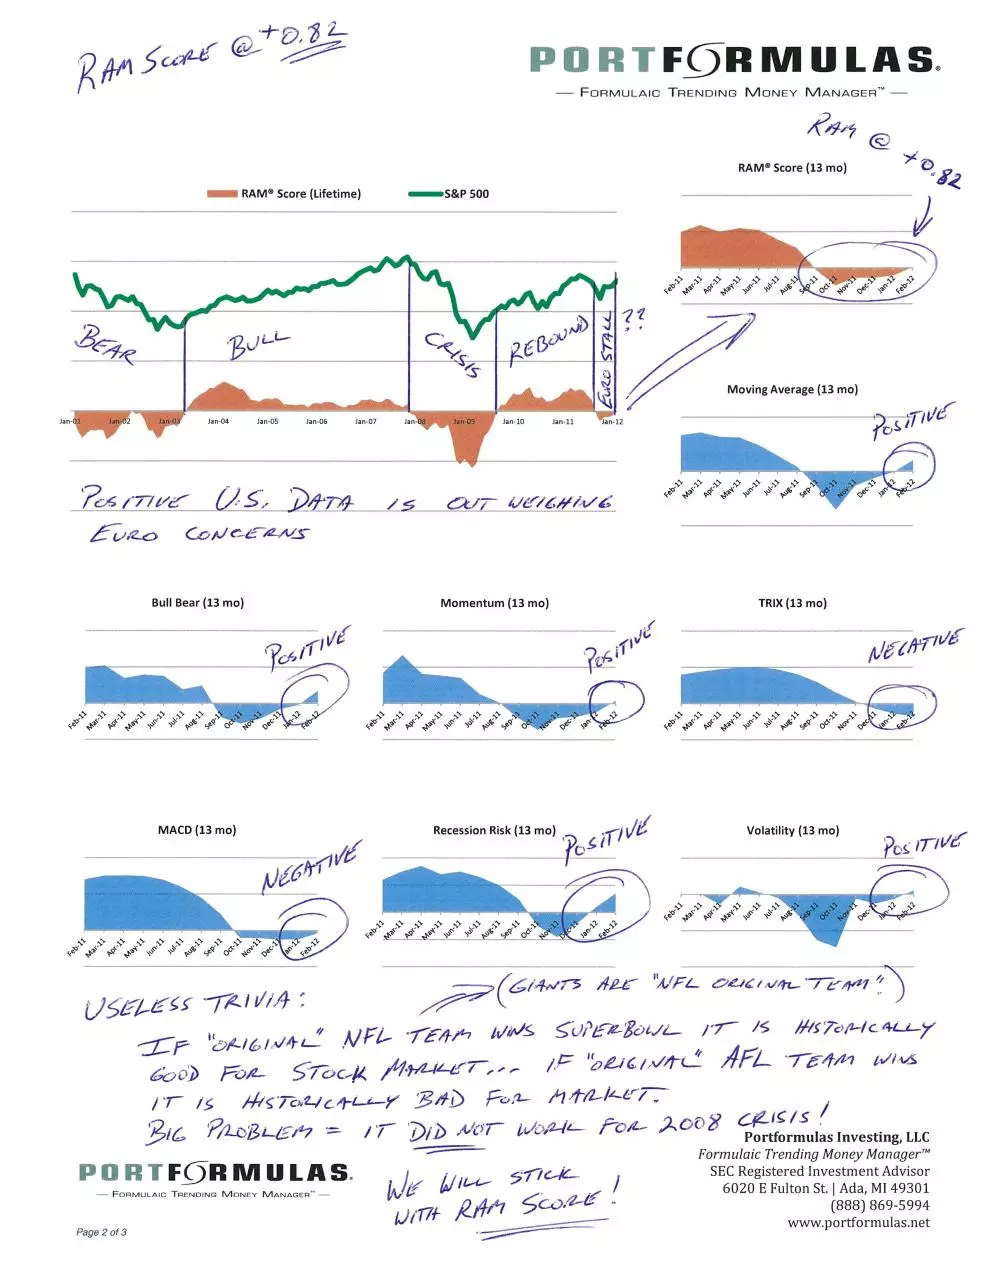
The overall RAM Score has increased from -21.74 last month to +0.82 this month... Driven by release of positive U.S. economic
data and increasing stock market performan
The battle between an improving American economic condition and the Eurozone debt concerns continues to rage on. Greece’s
string of delays in their reform discussions leaves many still worried, but the more positive economic data in the U.S. has initiated
the prevailing trend toward the positive. You may have already heard in the financial news that as far as “Januaries” go, this
January 2012, was the best since 1997. The result was that the S&P 500 posted a +4.36% return for the month.
However, in my opinion, even more promising than January’s performance was the way in which it a~Qqiplished this. You see,
since the S&P 500 reached its high on April 29, 2011, through the end of 2011, the inde -xperience(~3.Arading days in which
the daily gain or loss surpassed a +/- 1% for the day. That means the index average ‘~ch extreme movement days per month
over that 8 month timeframe. Assuming that the normal month has approximately 1-22 trading days (eliminating weekends
and holidays), you’re looking at close to 50% of the trading days acting like an out of control rollercoaster.
That’s kind of scary for most normal investors! Check out the stock chart below and view the movement within each month.
However, the month of January seemed to
finally settle down and establish some
I
I
I
I
V
I
~
~[‘
1’
(~
~
semblance of true direction. Throughout
January there were on ~I:ys registering a
daily gain or loss in excess of +1- 1%. So not
only did January look good from a month end
return perspective, but it accomplished this in a
significantly more favorable manner than we
have seen for some time now. Could it be that
a new trend is emerging?
‘
As a result, RAM Score reflects that 5 out of 7
subcomponents are now positive. This equates
to RAM Score posting a +0.82.
For more information and educational tools
you can visit www.portformulas.net or speak
Jun
Aug
Sep
Oct
Nov
Dec
Jan
Notice the saw tooth daily movementfor the months prior to Jan. 2012!
with your Financial Advisor.
Best of Investing,
Mike Walters, CEO
Portformulas Investing, LL,C
P 0 R T F.ç5R IVI U L A S
F0RMuLAIc TRENDING MONEY MANAGER
Form ulaic Trending Money Manager”
SEC Registered Investment Advisor
6020 E Fulton St. I Ada, MI 49301
(888) 869-5994
Page 1 of3
www.portformulas.net
�
o
~fr1 5c~r~-~
TF~YRMULAS
FORMULAIC TRENDING MONEY MANAGER”
RAM Score (13 mo)
RAM Score (Lifetime)
—S&P 500
.~1
‘>
.~E
~
.~E
.~E
,,
-~
~
~vv
%
d~I~I
e13&
p
F,
Moving Average (13 mc)
~?
6~ ≤,
i771’c(
/5
0
~
ie~e~—~.-,t’~j
~;:4~,
Bull Bear (13 mc)
Momentum (13 mc)
TRIX (13 mo)
,lIt11flL77LJ6~
‘~
MACD (13 mc)
—~
41
~÷~e
~
~LS1~
l?~/t ,~~/4- L~~’
P~A
) ‘T
3i~
/,~
ITIL~’6
I ~
,~4:;~;~’ (~≤e4≠’r5 4w ~,{. F/_
≤7~c-/.~
.7’~~4;
FORMULA~C TRENDING MONEY MANAGER
I
//6”≤
,%,zjL~T~.
,44Sr 7~-,’c 4-’-’—Y 3,~tj)
~
~ / ~v/4r_
‘7Z-’d’I
)‘7~ 1≤
,VF4-
P U R T FçjR IVI U L A S
Page2of3
~
Volatility (13 mo)
S
L)≤~~~≤c -7R i V//I’
~c2O)
,~-7
Recession Risk (13 mo)
vi
I
~
T
)i~_~‘
(41
L~1’~7~
~gdLJ~~_
,p~ ~
,4~i
7~4M
14//~~S
f~i- M 472-/4--trr:
~
/‘~-~-
,Qjfri
~X
517C-V--
1
-
≤C~~).
Form ulaic Trending Money Manager”~
SEC Registered Investment Advisor
6020 E Fulton St. I Ada, MI 49301
(888) 869-5994
www.portformulas.net
�
o
F~5RMULAS
FORMULAIC TRENDING MONEY MANAGER’~
Please note that there are a number of important disclosures that must be considered before investing in Portformulas. Please read the information and disclosures
contained in Portformulas’ hypothetical carefully before investing. Any performance figures referenced herein are hypothetical and are not indicative of future results.
Purchases and sales of secu~ties within Portformulas’ va~ous strategies may be made without regard to how long you have been invested which could result in tax
implications.
RAM Score General Disclosure
This illustration does not represent any particular Portformula strategy nor is it intended to recommend any Portformula strategy or the RAM Score feature. The
information on this page simply attempts to illustrate how our firm’s RAM Score Allocation Management feature operates. This feature can be applied to many Portformula
models at no additional cost.
RAM Score was not developed until January 2010. P~orto January 2010, clients were utilizing RAM Score’s predecessor, RAM. Clients utilizing RAM may have had
different results than clients utilizing RAM Score. RAM Score movement prfor to 2010 is hypothetical and based on retroactive application of RAM Score’s indicators to
market and economic conditions existing at the time. Portformulas was not managing assets pñor to 2007.
It is important to understand that RAM Score is only a tool designed to assist our firm’s management of your account. RAM Score does not guarantee any specific results
or performance and even with RAM Score on your account, it is possible that your account will lose value. RAM Score moves assets into or out of the market based on
varfous economic and market indicators. It is possible that the market will move positively while you are not invested or negatively while you are invested, resulting in
losses. Any Portformula strategy may underperfomi or produce negative results.
This illustration utilizes the S&P 500 index because it is a well-known index and provides a recognizable frame of reference. Indexes such as the S&P 500 are not
publically available investment vehicles and cannot be purchased. The S&P 500 has not endorsed Portformulas in any way.
P 0 R T Fç~5~R IVI U LA S
FORMU,A10 TRENDING MONEY MANAGER~
Page 3o13
Portformulas Investing, EEC
Form ulaic Trending Money Man ager0’
SEC Registered Investment Advisor
6020 E Fulton St. I Ada, Ml 49301
(888) 869-5994
www.portformulasnet
�
 Historical archive . public document