In-Class Questions for April 11
Part 1:
1. Let f (x) =
x
x2 −1
(a) Calculate f ′ (x) and f ′′ (x).
(b) Find the intervals on which f (x) is increasing/decreasing.
(c) Find the intervals on which f (x) is concave up/down.
Part 2:
1. Let f (x) = x2x−1 , like in Problem 1 in Part 1 above. Feel free to use
your calculations from earlier!
(a) Find the horizontal asymptotes of f (x).
(b) Find the vertical asymptotes of f (x). For each vertical asymptote
x = L, find
lim f (x) and lim+ f (x)
x→L−
x→L
(c) Use all of the information you’ve gathered so far to make a sketch
of f (x).
Proudly written by Corey. I can brag about this, right?
1
�
Part 1:
1. Let f (x) =
x
x2 −1
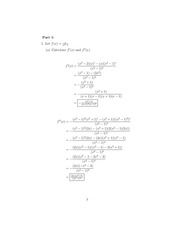
(a) Calcu1ate f ′ (x) and f ′′ (x).
(x2 − 2)(x)′ − (x)(x2 − 1)′
(x2 − 1)2
(x2 − 1) − (2x2 )
=
(x2 − 1)2
(x2 + 1)
=− 2
(x − 1)2
(x2 + 1)
=−
(x + 1)(x − 1)(x + 1)(x − 1)
f ′ (x) =
2
(x +1)
= − (x+1)
2 (x−1)2
(x2 − 1)2 (x2 + 1)′ − (x2 + 1)((x2 − 1)2 )′
(x2 − 1)4
(x2 − 1)2 (2x) − (x2 + 1)(2(x2 − 1)(2x))
=−
(x2 − 1)4
(x2 − 1)2 (2x) − (4x)(x2 + 1)(x2 − 1)
=−
(x2 − 1)4
2
(2x)(x − 1)((x2 − 1) − 2(x2 + 1))
=−
(x2 − 1)4
(2x)(x2 − 1 − 2x2 − 2)
=−
(x2 − 1)3
(2x)(−x2 − 3)
=−
(x2 − 1)3
f ′′ (x) = −
=
(2x)(x2 +3)
(x2 −1)3
2
�
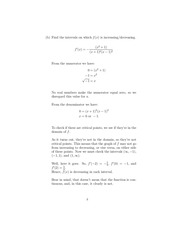
(b) Find the intervals on which f (x) is increasing/decreasing.
f ′ (x) = −
(x2 + 1)
(x + 1)2 (x − 1)2
From the numerator we have:
0 = (x2 + 1)
√
−1 = x2
−1 = x
No real numbers make the numerator equal zero, so we
disregard this value for x.
From the denominator we have:
0 = (x + 1)2 (x − 1)2
x = 0 or − 1.
To check if these are critical points, we see if they’re in the
domain of f .
As it turns out, they’re not in the domain, so they’re not
critical points. This means that the graph of f may not go
from increasing to decreasing, or vise versa, on either side
of these points. Now we must check the intervals (∞, −1),
(−1, 1), and (1, ∞).
Well, here it goes. So, f ′ (−2) = − 59 , f ′ (0) = −1, and
f ′ (2) = 95 .
Hence, f (x) is decreasing in each interval.
Bear in mind, that doesn’t mean that the function is continuous, and, in this case, it clearly is not.
3
�
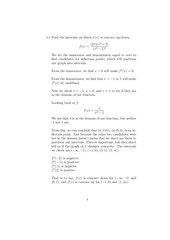
(c) Find the intervals on which f (x) is concave up/down.
f (x) =
(2x)(x2 + 3)
(x2 − 1)3
We set the numerator and denominator equal to zero to
find candidates for inflection points, which will partition
our graph into intervals.
From the numerator, we find x = 0 will make f ′′ (x) = 0.
From the denominator, we find that x = −1 or 1 will make
f ′′ (x) be undefined.
Now we check x = −1, x = 0, and x = 1 to see if they are
in the domain of our function.
Looking back at f :
f (x) =
x2
x
−1
We see that 0 is in the domain of our function, but neither
-1 nor 1 are.
From this, we can conclude that (0, f (0)), or (0, 0), is an inflection point. Just because the other two candidates were
not in the domain doesn’t mean that we don’t use them to
partition our intervals. They’re important, but they don’t
tell us if the graph of f changes concavity. The intervals
we check are (−∞, −1), (−1, 0), (0, 1), (1, ∞).
f ′′ (−2) is negative.
f ′′ (−.5) is positive.
f ′′ (.5) is negative.
f ′′ (2) is positive.
That is to say, f (x) is concave down for (−∞, −1) and
(0, 1), and f (x) is concave up for (−1, 0) and (1, ∞).
4
�
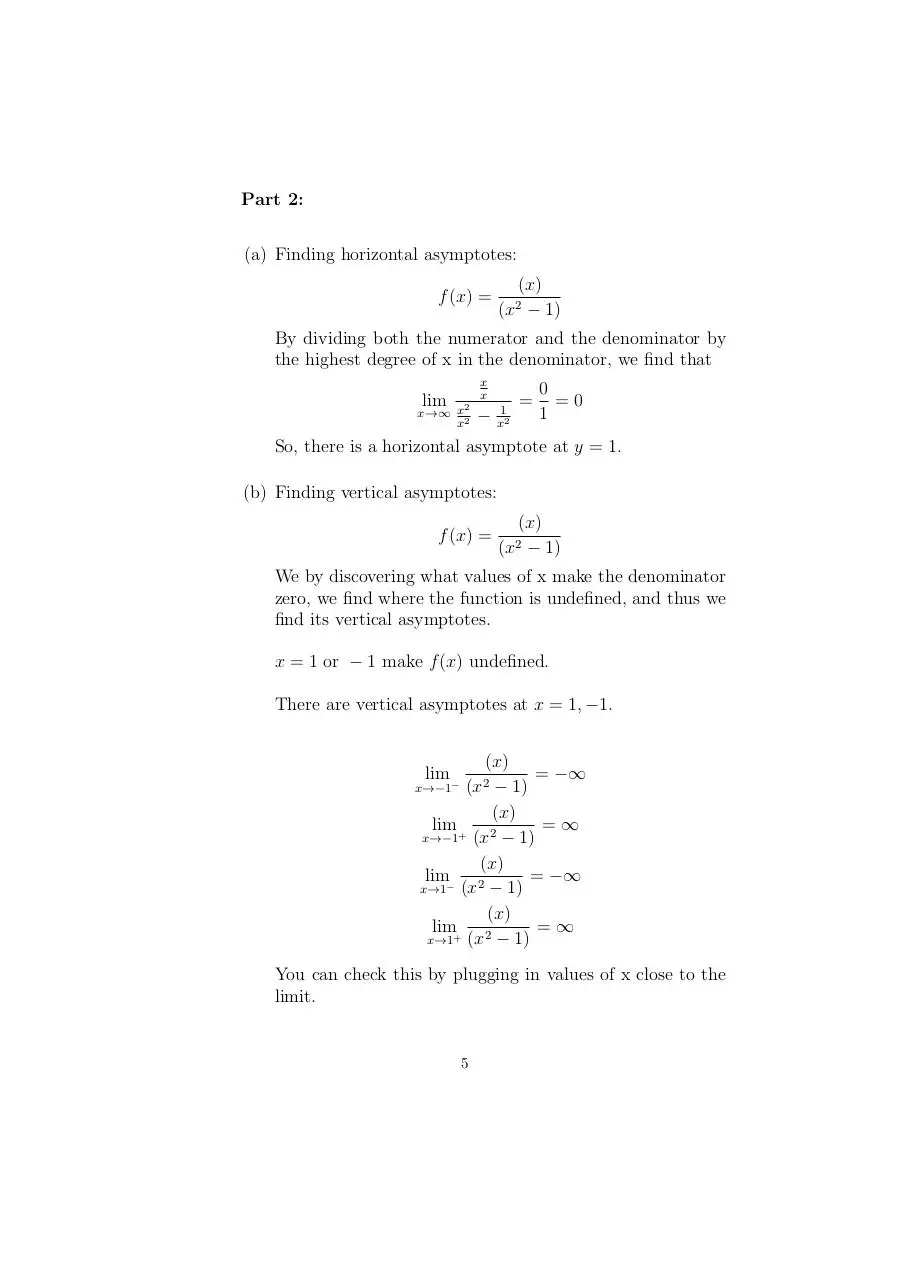
Part 2:
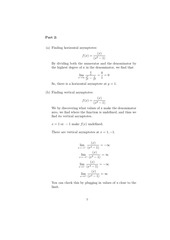
(a) Finding horizontal asymptotes:
f (x) =
(x)
− 1)
(x2
By dividing both the numerator and the denominator by
the highest degree of x in the denominator, we find that
lim
x→∞
x
x
x2
x2
−
1
x2
=
0
=0
1
So, there is a horizontal asymptote at y = 1.
(b) Finding vertical asymptotes:
f (x) =
(x)
(x2 − 1)
We by discovering what values of x make the denominator
zero, we find where the function is undefined, and thus we
find its vertical asymptotes.
x = 1 or − 1 make f (x) undefined.
There are vertical asymptotes at x = 1, −1.
(x)
= −∞
x→−1
− 1)
(x)
lim + 2
=∞
x→−1 (x − 1)
(x)
lim− 2
= −∞
x→1 (x − 1)
(x)
lim+ 2
=∞
x→1 (x − 1)
lim −
(x2
You can check this by plugging in values of x close to the
limit.
5
�
(c) Here are the graphs for f (x), f ′ (x), and f ′′ (x).
Plot[f [x], {x, −5, 5}]
2
1
-4
-2
2
4
2
4
-1
-2
Plot[f ′ [x], {x, −5, 5}]
-4
-2
-1
-2
-3
-4
-5
-6
6
�
Plot[f ”[x], {x, −5, 5}]
4
2
-4
2
-2
-2
-4
7
4
�
 Historical archive . public document