O sistema LASER em estudos de
estabilidade e de linearidade dos
fotomultiplicadores do TileCal em
ATLAS
Bruno Galhardo
Thursday, April 19, 12
�
Outline
• LHC, ATLAS, TileCal
• Sistemas de Calibração
• Sistema LASER
• Estabilidade
• Linearidade
• Conclusões
Thursday, April 19, 12
�
LHC
Thursday, April 19, 12
�
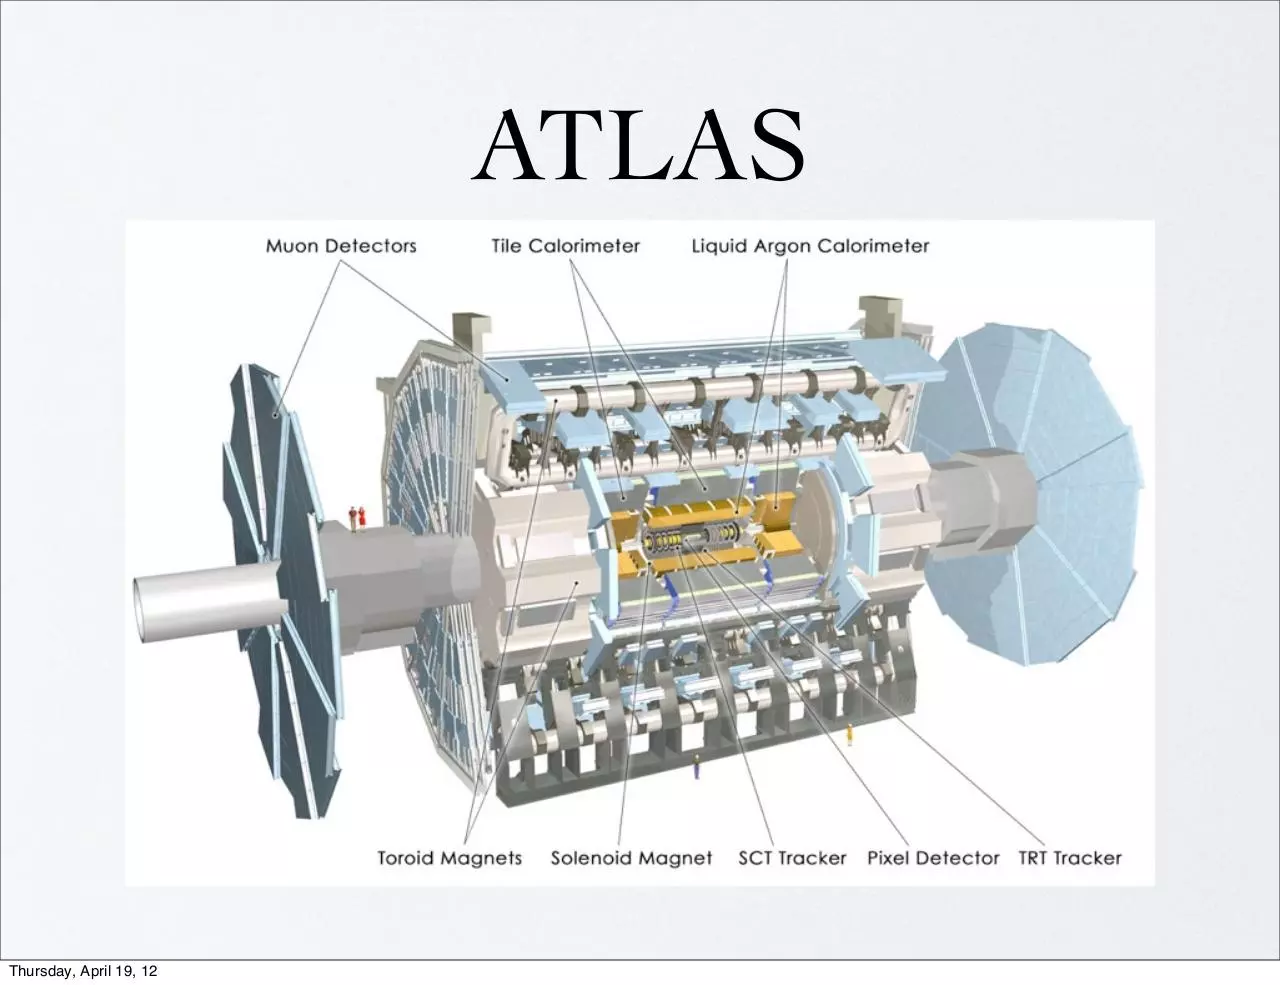
ATLAS
Thursday, April 19, 12
�
������� ����������������� �
������������������������
TileCal
TileCal MODULES
cell
�������
��
���
���
�9:�
�����
� ��������
����
$������������%&����� �����'
( )*+,-+�.�/"0-1+�⊕��0�* 2 �3�4!,
( )*+,-+�.�5""0-1+�⊕�5"0�* 2 �6�45,
�
Mede a radiação produzida
por partículas carregadas
nos cintiladores plásticos
PMT
WLS
fiber
1.60 m
Tile
11 Tile rows
Calor 2004 – Perugia
1 April, Calibration Session
3
5.64 m
Módulo do TileCal
Thursday, April 19, 12
?
Fran
(0.1
x
ATL
�
Sistemas de calibração
•
O objectivo da calibração é minimizar a diferença entre a
energia da partícula e a energia reconstruída pelo detector
•
Diferentes sistemas monitorizam e calibram diferentes partes
do TileCal
Thursday, April 19, 12
�
Sistema LASER
•
Pulsos do LASER produzem uma resposta nos
PMTs semelhante aos sinais produzidos por
partículas, com a vantagem que, no caso do
LASER conhecemos com precisão a energia inicial
•
A monitorizaçao do sistema é importante uma vez
que a resolução de energia vai depender bastante
da nossa compreenção da resposta dos PMT
•
Principal objectivo: medir a estabilidade e
linearidade dos 9852 PMTS usados no detector
Thursday, April 19, 12
�
in2p
LASER box
•
LASER - capaz de iluminar os 9852
PMTs do TileCal
•
Espelho semi reflector - divide a
luz entre o PD1/PMTs e o TileCal
•
4 fotodiodos - possibilitam medida
independente do sinal do LASER
•
2 PMTs - usados no trigger dos
eventos de LASER
•
Roda com 8 filtros - cada filtro com
1 atenuação, que possibilitam cobrir
todo o intervalo de energias do
TileCal [100MeV - 1.5TeV]
Thursday, April 19, 12
�
ed in Section 2, and some first results
ned during TileCal commissioning are
Conclusions are given in Section 4.
and linearity.
However, illuminating simultaneously 9
powerful light source. Pulse shape requi
width) has driven our choice toward a co
DPSS (Diode-Pumped Solid State) LAS
SPECTRA-PHYSICS [4]. This is a frequ
1º Splitter
- localizado
LASER
emitting
a 532nm perto
greenda
light be
box,
feixe em 384
theLaser
first part
ofdivide
a setupodescribed
on Fig. 1
fibras
que
vão
para
os
módulos
distinct parts: the LASER box and the lig
do TileCal (3 fibras vão para 3
fotodíodos da LASER box)
LASER box is the main component
provides its absolute calibration and trig
of theMarço
light 2011
emitted by the LASER hea
there and sent to one photodiode and tw
the TileCal PMTs). The photodiode is
calibration of the system, and the PMTs
the LASER events. In order to monitor li
levels, three other diodes are collecting
Splitter
- divide
luz para
first2ºbeam
splitter.
Theafour
photodiodes
um dos
PMTs
intocada
the same
thermally-regulated
box, ar
using an 241 Am radioactive source. T
Distribuição de luz
from
the
to the TileCal channels
Thursday,
AprilLASER
19, 12
Number of Events
•
Mean
167.3
RMS
32.41
Underflow
0
Overflow
0
35
30
25
20
15
10
5
0
0
•
50
100
150
200
250
300
mean fiber signal
�
outgoing light in order to cover the whole TileCal dynamic
(from 100 MeV/PMT to 1.5 TeV/PMT).
Runs de LASER
•
Semanalmente são efectuadas runs de LASER para
monitorização dos PMTs, para ganho alto (filtro 8) e baixo
(filtro 6).
2.2. Electronics and software aspects
is monitored,
controlled,
Adicionalmente, durante runs The
desystem
física,
impulsos
de and if necessary interlocked, by a set of 6 electronic cards located in a VME crate
LASER são enviados nos gapssituated
das right
partículas
para
below the LASER
box.verificar
This is also where the
timing of the LASER pulses is handled. Indeed, LASER event
o estado das PMTs durante a aquisição
de dados
are taken within ATLAS
normal physics run, during the 3 µs
Number of Events
Entries 10005
Mean
92.23
RMS
2.886
350
300
250
200
150
100
50
0
80
Thursday, April 19, 12
85
90
95
100
105
Signal (in pC)
in2p3-00461504, version 1 - 4 Mar 2010
•
Then, the light outgoing the LASER box is brought via a 1m
long liquid fiber towards a first beam-splitter. This splitter
dispatches the primary beam toward a bunch of ⇠400 clear
fibres. In order to improve the splitting uniformity, the amount
of light going out of the secondary fibres is tunable via dedicated connectors. Long clear fibers then bring the light from
the counting rooms (where the main system stands) to TileCal
modules. The light finally enters the modules where it is split a
last time before reaching the PMTs.
th
wa
on
ar
cu
to
gap occurring at the end of each LHC cycle. The timeline of a
LASER calibration pulse is sketched on Fig. 2.
Fig
PM
It
in
th
pr
4.
�
Monitorização e
Calibração
mic
1m
tter
lear
unt
ediom
Cal
it a
•
Estabilidade - A resposta do PMT
tem de ser constante no tempo
Figure 3: How linearity and stability are tested with the LASER system ?
•
then), have shown that PMTs relative stability over 100 days
Linearidade - A resposta de um
was better than 1% for most of the channels. Analyses are still
tem detests
aumentar linearmente
ongoing in order to improve those results.PMT
The linearity
are more sensitive to the system intrinsic stability,
and we are
com a energia
currently working on possible technical improvements in order
to fulfill the necessary requirements for those tests.
terrate
ythe
and stability are tested with the LASER system ?
Thursday, April 19, 12
�
StabilityEstabilidade
using the laser runs
5
Low Gain
•
High Gain
Relative Variação
variation using
the latest
run (17/03/2011)
0,10% / 0,12%
/ HG)
relativa
numa
run de 22/03/2011,
para (LG
todas
as
This is the
relativedesde
variation
run taken in feb. 23rd
PMTs
a w.r.t.
run the
anterior.
Thursday, April 19, 12
�
100
LASER in Phys runs
LASER Calib f6
LASER Calib f8
Estabilidade com o tempo
0
24/02
26/03
25/04
25/05
24/06
24/07
23/08 22/09 22/10
Time (day/month)
PMT Signal normalized
Figure 6: Comparison of the signal from photodiode 1 in the LASER box from physics runs and LASER
calibration runs.
1.03
LBA1 PMT1
1.02
1.01
1
0.99
0.98
0.97
•
•
•
Thursday, April 19, 12
LASER in Phys runs
LASER Calib f6
LASER Calib f8
Cesium runs
26/03
25/04
25/05
24/06
24/07
23/08
22/09
22/10
Time (day/month)
Figure 7: Comparison
the fourentre
samples, each
one normalized
to the their first2010
point value, for
Estabilidade
debetween
1 PMT
Março
e Outubro
one TileCal PMT (PMT1 in LBA1): in black the values from the physics runs, in red and green from the
LASER calibration runs using filter 6 and 8 respectively and in blue the Cesium runs. The PMT response
on the LASER runs with filter 8 (6) was normalized to the LASER box photodiode 2 (4) signal.
Resultados normalizados aos fotodíodos
Variações menores que 1%
�
PMT Signal normalized
PMT Signal normalized
1.05
1
0.95
0.9
1
0.95
0.9
Correlação entre runs
0.85
0.85
0.8
LASER in Phys runs
LASER Calib f6
LASER Calib f8
Cesium runs
0.75
0.7
0.65
DRAFT
November 15, 2010 – 18 : 29
26/03
25/04
25/05
0.8
0.75
24/06
1124/07
23/08
22/09
22/10
Time (day/month)
LASER in Phys runs
LASER Calib f6
LASER Calib f8
Cesium runs
26/03
25/04
25/05
0.9
0.85
0.95
1
0.99
0.9
0.98
LASER in Phys runs
LASER Calib f6
LASER Calib f8
Cesium runs
0.85
0.8
0.97
LASER in Phys runs
LASER Calib f6
LASER Calib f8
Cesium runs
0.75
0.7
0.65
26/03
25/04
25/05
LASER in Phys runs
LASER Calib f6
0.96
LASER Calib f8
Cesium runs
0.8
0.75
24/06
24/07
23/08
22/09
22/10
Time (day/month)
26/03
25/04
25/05
24/06
0.99
0.98
0.97
0.96
LASER in Phys runs
LASER Calib f6
LASER Calib f8
Cesium runs
26/03
25/04
25/05
1.02
1
0.98
(a)
0.9
0.75
0.9
24/07
0.88
0.7
LASER in Phys runs
LASER Calib f6
23/08 LASER
22/09 Calib
22/10f8
Time
(day/month)
Cesium
runs
26/03
25/04
25/05
0.65
(c)
24/07
0.85
0.8
0.94
0.75
0.9
24/07
0.88
0.7
LASER in Phys runs
LASER Calib f6
23/08 LASER
22/09 Calib
22/10
f8
Time
(day/month)
Cesium
runs
26/03
25/04
25/05
0.65
LASER in Phys runs
LASER Calib f6
LASER Calib f8
Cesium runs
26/03
24/06
24/07
25/04
25/05
23/08
22/09
22/10
Time (day/month)
24/06
24/07
(b)
1.02
1
0.94
0.92
0.9
0.88
LASER in Phys runs
LASER Calib f6
LASER Calib f8
Cesium runs
26/03
24/06
0.9
(c)
0.85
0.94
0.95
0.96
0.92
24/06
23/08
22/09
22/10
Time (day/month)
0.98
1
Figure 12: Examples of some
0.98 PMTs with unstable behavior but with good corr
LASER and the Cesium runs:0.96a) EBC42 - PMT29, b) EBC53 - PMT43 and c) LBC1
0.95
0.8
(a)
•
1
0.96
0.92
24/06
25/05
1
PMT Signal normalized
1
PMT Signal normalized
1.01
24/07
25/04
1.02
(b)
PMT Signal normalized
PMT Signal normalized
(a)
26/03
PMT Signal normalized
0.95
1
1.01
24/07
(b)
PMT Signal normalized
1
PMT Signal normalized
1.05
PMT Signal normalized
PMT Signal normalized
(a)
24/06
25/04
25/05
23/08
22/09
22/10
Time (day/month)
24/06
(b)
0.86
0.84
0.82
24/07
23/08
22/09
22/10
Time (day/month)
LASER in Phys runs
LASER Calib f6
LASER Calib f8
Cesium runs
26/03
25/04
25/05
24/06
24/07
23/08
22/09
22/10
Time (day/month)
(c)
PMT Signal normalized
Figure 13: Examples of some PMTs with unstable behavior and with disagreement
Informação
das
diferentes
runs
são
úteis
para
perceber
a
and
the
Cesium
runs:
a)
LBA17
PMT1,
b)
LBC22
PMT8
and c) EBA43 - PMT3
Figure 12: Examples of some PMTs with unstable behavior but with good correlation between the
LASER and the Cesium
runs: a) EBC42
b) EBC53 -de
PMT43
and c)
LBC12 - PMT18.
origem
do- PMT29,
problema
um
determinado
PMT
1.02
1
0.98
0.96
0.94
0.92
0.9
0.88
Thursday, April 19, 12
0.86
LASER in Phys runs
LASER Calib f6
�
Comparação com o
Cesium
Three cases
4
!
Different cases have to be treated :
Period 09/2009 # 02/2010
Case 1 : Small variations
Case 2 : Significant variations
Seen by Las and Cs
Case 3 : Disagreement
between Las and Cs
•
Thursday, April 19, 12
Com algumas excepções, para variações maiores que 3%,
quando o LASER mede uma grande variação o Cesium
mede a mesma variação
�
Linearidade
•
•
•
Runs para 7 filtros diferentes
•
Intervalo do fotodíodo 4 ajustado para cada filtro de forma a conter os
sinais de 14k a 30k
•
•
Fit linear (2 parâmetros) para cada filtro y = a.(x - b/a)
Com 6 intensidades de LASER: 14k, 18k, 22k, 26k, 28k and 30k
Não se consideram sinais maiores que 700GeV onde se começa a verificar
não linearidade
fit − PMT
Residual =
fit
Resíduos calculados para cada ponto
PMT_000 F1
PMT signal/PD signal
y = ax
0.3
0.29
0.28
0.27
PMT signal (in GeV)
PMT_000 F6
-3
×10
120
100
y = a(x - b/a)
80
0.26
60
0.25
40
0.24
0.23
20
0.22
Fit example
Thursday, April 19, 12
200
400
600
800
1000
1200
1400
1600
1800
PD4 signal (in ADC)
0
200
400
600
800
1000
1200
1400 1600 1800
PD4 signal (in ADC)
�
Offsets (b/a)
300
Entries
Mean
RMS
Underflow
Overflow
F1
9609
60.71
13.76
40
297
600
F2
500
250
200
400
150
300
100
200
50
100
Entries
Mean
RMS
Underflow
Overflow
9603
57.32
6.843
9
420
180
160
Entries
Mean
RMS
Underflow
Overflow
F3
9598
58.61
21.21
318
864
140
120
100
80
60
40
0
0
10
20
30
40
50
60
70
80
300
F4
0
0
100
Entries
Mean
RMS
Underflow
Overflow
400
350
90
20
9543
55.5
10.81
11
155
300
10
20
30
40
50
60
70
80
100
Entries
8241
Mean
74.27
RMS
10.33
Underflow
2
Overflow
24
F5
250
90
0
10
20
30
40
50
60
70
80
350
100
Entries
Mean
RMS
Underflow
Overflow
450
400
90
F6
300
250
200
250
200
150
200
150
150
100
100
100
50
50
0
0
10
20
30
40
50
60
70
80
F8
250
200
150
100
50
0
0
10
20
Thursday, April 19, 12
30
40
50
60
70
80
90
0
0
100
Entries
Mean
RMS
Underflow
Overflow
350
300
90
100
50
9609
62.66
10.73
20
57
10
•
•
•
20
30
40
50
60
70
80
90
100
0
0
10
20
30
40
50
60
70
Offset atribuido ao PD4
Valor médio ~60 para todos os filtros
Parâmetros variam bastante
80
90
100
9592
67.17
7.91
7
18
�
Resultados
•
Plot com o resíduo médio em cada ponto vs o sinal médio de todas as
PMTs do TileCal para cada combinação filtro/intensidade
•
Os erros são a RMS dos histogramas
Filter 1
Filter 2
2
Filter 3
Filter 4
1.5
Filter 5
Filter 6
Filter 8
1
0.5
without 14k
Residuals (in %)
Residuals (in %)
with 14k
Filter 4
0.5
-1
-1
-1.5
-1.5
10
2
10
Mean PMT Signal (in GeV)
Filter 8
1
-0.5
1
Filter 5
Filter 6
-0.5
-1
Filter 3
1.5
0
10
Filter 2
2
0
-2
Filter 1
-2
-1
10
1
10
2
10
Mean PMT Signal (in GeV)
•
Removendo o ponto relativo à intensidade de LASER mais baixa, 14k, de cada
filtro os resultados centram-se no zero e com variações menores que 0.5%
•
Filtro 3 com RMS maior porque o intervalo de energias se encontra na
transição entre ganho alto e baixo
Thursday, April 19, 12
�
Fit com todos os filtros
•
•
•
Aplicando a correção f em cada fit por filtro y = a.f.(x - b’)
f para cada filtro é normalizado ao f5 para cancelar erros sistemáticos
O valor do PD é corrigido com o valor médio b’ tirado dos fits
individuais
Residuals (in %)
without 14k
Graph
Graph
700
400
600
350
300
500
250
400
200
300
Filter 1
Filter 2
3
Filter 3
Filter 4
Filter 5
2
Filter 6
Filter 8
1
0
150
200
100
0
0
-1
100
50
200
400
600
Fit example
800
1000
1200
1400
1600
1800
0
0
200
400
Bad fit example
600
800
1000
1200
1400
-2
-3
-1
10
1
•
•
Parâmetro f tem elevada precisão, baixo RMS
•
Não é uma boa maneira de identificar as “más” PMTs.
10
Maior fonte de erros vem de b’. O qual tem grande impacto para
alguns PMTs
Thursday, April 19, 12
2
10
Mean PMT Signal (in GeV)
�
PMT aleatória do
TileCal como referência
Residuals (in %)
Filter 2
Filter 3
6
Filter 4
Filter 5
Filter 6
4
Filter 8
2
Filter 1
Filter 2
Filter 3
6
Filter 4
Filter 5
Filter 6
4
Filter 8
2
EBC32_5 as reference
Filter 3
6
-2
-2
-4
-4
-4
-6
-6
-6
2
-1
10
Mean PMT Signal (in GeV)
PD4 as reference
10
1
10
2
10
Mean PMT Signal (in GeV)
Filter 8
2
-2
10
Filter 6
4
0
1
Filter 4
Filter 5
0
-1
Filter 1
Filter 2
0
10
Residuals (in %)
EBA23_3 as reference
Residuals (in %)
Filter 1
Residuals (in %)
LBA12_1 as reference
-1
10
1
10
Filter 1
Filter 2
Filter 3
6
Filter 4
Filter 5
Filter 6
4
Filter 8
2
0
-2
-4
-6
-1
10
1
Thursday, April 19, 12
10
2
10
Mean PMT Signal (in GeV)
•
•
Fit de 1 parâmetro y = ax
Usando todas as intensidades
2
10
Mean PMT Signal (in GeV)
�
PMT da mesma fibra
como referência
Residuals (in %)
PMT from the same fiber as reference
Filter 1
Filter 2
3
Filter 3
Filter 4
Filter 5
2
Filter 6
Filter 8
1
•
•
Fit y = ax
•
Resíduos menores que
1%
0
-1
-2
-3
-1
10
Thursday, April 19, 12
1
10
2
10
Mean PMT Signal (in GeV)
Comparando 2 PMTs da
mesma fibra (depois do
2o splitter) as variações
médias desaparecem
�
Comparação dos 3 PD
Residuals (in %)
PD3 - Filter 6
10
PD2 - Filter 8
8
PD4 - Filter 6
6
PD4 - Filter 8
4
2
0
-2
-4
-6
-8
-10
•
Thursday, April 19, 12
-1
10
1
10
2
10
Mean PMT Signal (in GeV)
Há um bom acordo entre os resultados usando o PD2 e
PD3 e o PD4
�
PD1 e PMT1
Filter 1
10
Filter 2
8
Filter 4
6
Filter 6
Filter 3
Filter 5
Filter 8
4
8
Filter 4
6
Filter 6
0
-2
-2
-4
-4
-10
-1
10
Filter 3
Filter 5
Filter 8
4
0
-8
PMT 1
-6
-8
1
10
with 14k
Residuals (in %)
Filter 2
2
PD1
2
10
Mean PMT Signal (in GeV)
Filter 1
10
2
-6
-10
-1
10
1
10
2
10
Mean PMT Signal (in GeV)
Filter 1
10
Filter 2
8
Filter 4
6
Filter 6
Filter 3
Filter 5
Filter 8
4
2
0
-2
-4
-6
PD1
-8
-10
without 14k
Residuals (in %)
Residuals (in %)
without 14k
-1
10
Thursday, April 19, 12
1
10
2
10
Mean PMT Signal (in GeV)
•
•
Grandes variações nos resíduos
Referência após o 1o splitter necessária
para cancelar os erros introduzidos pelo
sistema
�
Conclusões
Thursday, April 19, 12
•
Resultados da estabilidade mostram variações médias
menores que 1%
•
PMTs com maus comportamentos facilmente identificáveis
pelo sistema
•
Para a linearidade ainda não há um bom método para
determinar linearidade em todo o intervalo de energias.
•
Confirmam-se alguns erros sistemáticos introduzidos pelo
sistema óptico ao longo do sistema
�
 Historical archive . public document