J Forensic Sci, May 2013, Vol. 58, No. 3
doi: 10.1111/1556-4029.12119
Available online at: onlinelibrary.wiley.com
PAPER
CRIMINALISTICS
Samuel Nunn,1 Ph.D.
Touch DNA Collection Versus Firearm
Fingerprinting: Comparing Evidence
Production and Identification Outcomes*
ABSTRACT: A project by a metropolitan police agency in 2008–2009 had police use touch DNA kits to collect cell samples from seized
firearms. To assess outcomes, results of touch DNA swabbing of firearms were compared to fingerprinting firearm evidence. The rationale was
that fingerprinting, as the older technology, was the baseline against which to compare touch DNA. But little is known about ways to measure
touch DNA productivity compared to fingerprinting. To examine differences between the two requires comparable measurements. Two measures were used: quantity of probative or investigative evidence produced and identification outcomes. When applied to firearms seized within
an Indianapolis, IN police district, touch DNA produced a larger volume of evidence than fingerprinting, but identification outcomes for the
two methods were equal. Because touch DNA was deployed by police patrol officers, there are implications for firearm forensics and the choice
of forensic approaches used by police.
KEYWORDS: forensic science, touch DNA, firearms, fingerprinting, evidence collection, police forensics
Touch DNA technology is an evidence gathering approach that
attempts to collect and produce viable DNA samples from small
quantities of skin cells deposited after an individual has touched
objects or places (1,2). Its use expanded in recent years, alongside
growth of forensic DNA profiling (3,4). Touch DNA was first
used in the United Kingdom around 1999 (5) and 2003 in the
United States (6) and has had some success in both countries as a
method of identifying suspects in burglaries and vehicle thefts
(5,7–9). This success has created pressure on police and forensic
agencies to use touch DNA methods for more specific offenses
such as firearm crimes or other volume offenses (7,10–12), and
touch DNA approaches have diffused widely (13). Touch DNA
evidence collection kits are now deployed by a variety of operating police units (e.g., patrols, violent crime units, gun seizure
units, auto theft, evidence collection officers, and detectives).
It is not surprising that the use of touch DNA has expanded,
for several reasons. DNA analysis “has set the bar higher for
other forensic science methodologies, because it has provided a
tool with a higher degree of reliability and relevance than any
other forensic technique” (14, p. 41) and has a demonstrated
capacity to connect persons to evidence items and crime scenes.
Considered from the perspective of technique, the collection of
touch DNA samples is comparatively easy, involving the use of
1
School of Public and Environmental Affair (SPEA), Center for Criminal
Justice Research (CCJR), Indiana University – Purdue University Indianapolis, 801 West Michigan Street, Indianapolis, IN 46202-5152.
*Funded by 2010 local research partner grant award from the U.S. Attorney’s Office, Southern District of Indiana Project Safe Neighborhoods to the
Indiana University Public Policy Institute and Center for Criminal Justice
Research.
Received 30 Nov. 2011; and in revised form 10 Feb. 2012; accepted
16 April 2012.
© 2013 American Academy of Forensic Sciences
moist sterile cotton applicators, applied along specific surfaces
(e.g., windowsills, firearm magazines, and steering wheels), and
stored into evidence containers. Touch DNA samples can be
collected by persons with otherwise little background in DNA
collection. Collecting touch DNA samples does not necessarily
require a fully trained evidence technician or crime scene specialist, and as shown here, rank and file police patrol officers
have been asked to perform touch DNA evidence collection.
Finally, police administrators can correctly characterize touch
DNA evidence kits as tangible initiatives directed at focused
targets such as burglaries or firearm recoveries (15).
But it is surprising that the widespread adoption of touch
DNA techniques has occurred without much analysis and debate
about its comparative effectiveness as an evidence gathering
technique. Analysts have identified problems in touch DNA
approaches linked to transference, contamination, and low copy
number DNA samples (1,16–18). In touch DNA deployment,
there is sometimes a marked change from the group traditionally
tasked to collect DNA samples—reliance on evidence technicians or crime scene specialists has gradually given way to street
patrol officers—which might increase the probability of transfer,
contamination, or chain of evidence questions. As well, touch
DNA approaches to firearm crime are in the earliest stages and
have received few systematic evaluations. In addition to a lack
of evaluation of the touch DNA method, there is an absence of
studies comparing touch DNA approaches to other forensic
methods (13). Further, DNA profiling in the criminal justice system is a comparatively expensive forensic tool, and long DNA
testing backlogs are common in public forensic agencies.
Assuming expanded use of touch DNA will add to these backlogs, it would be useful to know more about the comparative
effectiveness of touch DNA approaches. Add to that the standard
principle that new or retooled forensic technologies should be
601
�
602
JOURNAL OF FORENSIC SCIENCES
thoroughly tested in the field to be adopted or rejected, and it
becomes less clear why touch DNA techniques have diffused
rapidly when we know little about their effectiveness vis-�a-vis
other techniques. Even though it has been adopted widely, its
effectiveness is untested in comparison with other possible
methods of evidence collection.
So, it would seem prudent to identify situations in which
touch DNA approaches can be examined to detail their various
outcomes or in comparison with other established methods of
evidence collection to determine whether touch DNA is demonstrably better than alternative approaches. During 2008–2009, a
pilot project was implemented in Indianapolis, Indiana, in which
police patrol officers used prepackaged touch DNA swab kits
(called TriggerPro) to collect human cell samples from seized
firearms. From July 2008 through August 2009, the Indianapolis
Metropolitan Police Department (IMPD) East District patrol officers were supplied with TriggerPro kits for use in collecting
possible DNA samples from firearms seized during field stops or
other criminal incidents. Traditionally, if such samples were
desired, evidence technicians or crime scene specialists from
either the Indianapolis-Marion County Forensic Services Agency
(IMCFSA) or IMPD had used sterile cotton applicators (swabs)
and distilled water as the standard touch DNA collection mechanisms. TriggerPro was a self-contained unit of three swabs,
moistened by cracking open a surrounding container of antimicrobial fluid, and was to be used by police patrol officers.
Evaluation of the TriggerPro pilot project compared two
forensic methods: fingerprinting firearms versus collecting touch
DNA samples from firearms. In effect, fingerprinting was the
baseline against which TriggerPro was compared. Both methods
were examined by comparing production of touch DNA evidence developed from TriggerPro swabs to fingerprint evidence
harvested from firearms. Considering both methods, the pilot
project focused on two research questions: how much potential
forensic evidence was gathered and how useful was that information for suspect identification?
Touch DNA and Fingerprinting in Firearm Forensics
When firearms are seized, they are processed in different ways
by law enforcement and forensic personnel. Firearms can be:
•
•
•
•
•
•
Photographed or imaged in situ (Firearms must be disarmed
and rendered safe by police, so further forensic examination
occurs after police personnel have handled the weapon.);
Examined visually for visible fingerprints;
Subjected to physical and chemical processes to raise latent
fingerprint images;
Swabbed by cotton applicators (i.e., “q-tips”) to gather human
cells containing DNA;
Examined for serial numbers (which produce information
about manufacturers, distributors, retailers, and owners linked
to numbers; and information input into “crime gun” databases
to see whether seized firearms are linked to previous cases);
and/or
Test fired, with the fired bullets and cartridge cases examined
and submitted to local, state, and federal databases (which
produce information on whether the firearm or bullet can be
linked to Integrated Ballistics Information System cartridge
case and bullet image databases).
Forensic firearm processing involves multiple techniques, and
therefore, choices must be made about which techniques to use.
The sequence of steps is somewhat fixed (although agency
policies might affect the procedures used), but does involve
possible decision-making points (which sometimes have high
situational or circumstantial components) (19). For instance, a
picture of the firearm in the crime scene has to be done at the
time it is found. At this point, the police are actively involved
due to their frequent contact with firearms in the street. They must
confiscate and render firearms safe, but without transferring cells
of their own, or otherwise disturbing latent or trace evidence. If
responding officers have no camera and the crime scene must be
cleared, they must either draw it or commit it to memory. Examining serial numbers could occur immediately or later. Test firing
would likely come last, after the firearm has been processed
through a police evidence room and transported to the forensic
agency.
But before the firearm is test fired (if it is), decisions are
required on whether to process the firearm for human cell samples or fingerprints—two procedures that, while not mutually
exclusive, are not necessarily fully compatible (12,20). Fingerprint processing increases handling of the firearm by other
persons, magnifying risk of cell transference and contamination
(8,17,18). Using moist swabs to collect human skin cells can
smear or damage latent fingerprint images (i.e., oil and perspiration deposits on the firearm). Studies have found that in cases
where fingerprinting precedes DNA swabbing, “most fingerprinting development…techniques do not affect subsequent DNA
analysis” (20, p. 732), although the quantities of DNA samples
are often reduced (1,16–18). The question of what touch DNA
processing does to fingerprint productivity remains open, so
uncertainties about the order of forensic techniques have not
been eliminated, even if the general practice is to attempt developing fingerprints first, followed by DNA swabbing.
In any event, there is no research on the comparative productivity of DNA swabbing versus fingerprinting for collecting
evidence from firearms. Despite a long history of firearm fingerprinting, few studies have examined the productivity of fingerprinting firearm-related evidence items (21). The comparative
analyses performed for the TriggerPro evaluation can provide
information helpful in making choices about which technique to
use and the circumstances conducive to one or the other
evidence collection approach.
Evaluation Terms, Research Questions, and Data
To isolate the impacts of touch DNA applied to firearms, this
analysis uses a comparison group approach, in which identification outcomes of touch DNA firearm cases are arrayed against
those of firearm fingerprint cases. How should the outcomes of
the two techniques be compared? To examine differences
between the two requires comparable measurements, yet specifying common identification outcomes is not straightforward, due
to differences in the ways touch DNA and fingerprinting are
measured. Two outcome measures were used: (i) quantity of
probative or investigative evidence produced and (ii) identification
results. The way these measures were developed is explained by
examining the definition of terms used in the analysis.
Working Definitions
Individualization is “the process of linking physical evidence
to a common source … [it is the] assignment of a unique source
for a given piece of physical evidence” (22, p. 128). Individualization of fingerprint evidence occurs when a latent fingerprint
image is declared by a fingerprint examiner to be that of a
�
NUNN
specific person. Individualization of touch DNA evidence occurs
when the evidentiary DNA profile is linked to an individual’s
DNA profile “to a reasonable degree of scientific certainty.”
Fingerprint-Related Definitions
With fingerprints, images of visible or latent prints taken from
firearm-related surfaces are examined to identify enough points
of comparison to include or exclude an individual from having
touched the evidence. Fingerprint analysis is based on comparisons of photographic or digital images of latent prints. Several
forensic outcomes are possible. In the first place, fingerprint
images obtained from firearms would be examined for suitability. An image is considered suitable when it has a sufficient quality and quantity of fingerprint ridge detail to permit comparison
with other images. A more successful situation involves developing a suitable fingerprint image, but no subsequent success in
matching it to other known fingerprint samples (no match);
the unknown fingerprint image might or might not be uploaded
to local, state, or federal data repositories, but it could be.
Most successfully, a suspect identification (a match) would
occur when the firearm fingerprint was matched to a known
individual.
DNA-Related Definitions
No viable profile: a DNA sample might produce no viable
profile, which yields no useful information.
Inconclusive: the U.S. government’s DNA Initiative (23)
states that “inconclusive” refers to “a situation in which no conclusion is reached regarding testing done due to one of many
possible reasons (e.g., no results obtained, uninterpretable results
obtained, no exemplar/standard available for testing)” (p. 5).
Single source: samples of DNA that come from a single
source and which could therefore potentially be individualized to
a specific person.
Mixture: this is a mixture of DNA samples from different
individuals, in which multiple persons left biologic material on
the evidence item. Mixtures can be problematic, but are not
necessarily without value. Analysts have noted that “one of the
most common complications in the analysis of DNA evidence is
the presence of DNA from multiple sources… [B]y their very
nature mixtures are difficult to interpret” (24, p. 21). Mixtures
can produce partial and complete DNA profiles, but because
they are products of more than one person, additional analyses
are required to parse individual contributions. Mixtures can
include major and minor contributors. The major/minor mixture
is “a DNA profile where multiple individuals have contributed
biologic material and one individual’s DNA profile is more
apparent” (23, p. 6) and can sometimes prove useful in excluding or including individuals as having contributed the evidentiary
sample. Thus, there can be cases where mixtures are successfully
used to determine an individual’s inclusion or exclusion as
contributor to the evidentiary DNA sample. In many other
instances, however, individuals cannot be practically separated
into distinct contributors, and in those cases, the DNA mixture
offers inconclusive results of little or no value.
Complete profile/partial profile: The FBI’s Combined DNA
Indexing System (CODIS) defines a complete DNA profile as
the detailed allele information at each of the 13 core genetic loci
used for forensic identification (25). To develop a match, the
alleles at each of the 13 core loci in DNA samples collected
from the scene or evidence item are compared to the same
.
TOUCH DNA VERSUS FINGERPRINTING
603
chromosomal locations developed from a known reference or
elimination standard. A complete profile would be composed of
all allele information contained at each of the 13 core loci; anything less would be considered a partial profile. Technically, any
profile developed from fewer than 13 core loci is by definition
partial. Related to this, the FBI officially permits CODIS uploads
and searches only on the basis of 13 loci profiles—but that does
not mean that profiles with fewer loci have no value or that they
contain no useful information. Matches on as few as six to eight
(or less) of the core loci can determine that an individual cannot
be excluded (or, in the case of nonmatches, can be excluded) as
the source of a DNA sample. Unofficially, as practiced by the
IMCFSA, CODIS searches are sometimes permitted on fewer
than 13 loci, but the FBI will not run searches on fewer than
nine loci. The Indiana state DNA database permits uploads for
cases with as few as eight of the 13 loci. Thus, partial profiles
can have investigative value under some circumstances. Nonetheless, the value of partial DNA profiles for investigations or
trials is controversial and contingent on how many and which of
the 13 core loci are involved (24,26–28).
The IMCFSA classified DNA identifications in one of three
ways: (i) no match between the DNA sample and reference sample, (ii) the DNA sample cannot exclude the source of reference
sample as a contributor, or (iii) a match between the two. The first
classification has investigative value because it eliminates a suspect. The second classification also has investigative value, but is
ambiguous and limited in its power of individualization; there
might be some value added if it is used in other future DNA profile
searches. The third classification has value because it definitively
links the sample to a suspect. The IMCFSA DNA section referred
to the ii and iii classifications above as, respectively, nonstats or
stats identifications. In a nonstats identification, a partial match
between the profiles from the evidence item and reference standard
means the suspect cannot be linked uniquely to the DNA sample,
but cannot be excluded as a possible contributor. In a stats identification, statistical calculations are provided once a match is established between a DNA profile from the evidence item and the
DNA profile from a provided reference standard. According to the
IMCFSA, an “identity-to-the-source statement” accompanies a
match where calculations render statistical results that mean it is
virtually certain that a suspect with a matching profile is the source
of the evidentiary sample.
Research Questions
Production of Forensic Evidence—As different methods of
collecting firearm evidence, what is the comparative effectiveness
of touch DNA swabbing versus fingerprinting? For a given
seized firearm, does it produce a viable latent fingerprint or a
DNA profile? A viable DNA sample could be a partial or complete profile, while a fingerprint was either a suitable image or
not. In effect, touch DNA has two possible successful outcomes
and fingerprints only one. This can be shown by examining the outcome metrics used. The measure of success for fingerprinting is
development of at least one viable fingerprint image (from firearm-related evidence) capable of being linked to a person or useful for further investigative or forensic purposes (e.g., searching a
forensic database). The measure of success for touch DNA swabbing is production of at least one DNA profile capable of including or excluding an individual as having contributed DNA to the
firearm. A complete DNA profile has the highest (potential)
value. A partial DNA profile has value if it is at least capable of
including (not excluding) an individual as a possible contributor.
�
604
JOURNAL OF FORENSIC SCIENCES
Use of Evidence for Identification—If usable forensic evidence
is collected, what is the effectiveness of touch DNA swabs
compared to fingerprints to provide a positive identification? This
question focuses on the frequency a viable DNA profile or fingerprint was obtained from firearms and used to link an individual
to the firearm or fail to exclude an individual from having contributed to the sample. The comparison involves the probability a
recovered firearm will produce some type of DNA profile that
can be matched to a reference (suspect) sample versus the probability that a recovered firearm will produce a viable fingerprint
that is matched to an individual. The identification outcome is
confirmation or exclusion of a suspect as the sample contributor.
TriggerPro and Firearm Fingerprint Data
Gun swab cases and gun fingerprint cases were drawn from
the same operating field environment: the IMPD East District
over a two-year period from July 2007 to August 2009. TriggerPro cases were developed from IMPD East District firearm incidents. During the July 14, 2008–August 31, 2009 period in the
East District, there were 831 firearm cases, and of those, 164
became TriggerPro cases. Complete data on 160 of the TriggerPro cases were assembled from IMCFSA laboratory information
management system (LIMS) reports.
Data on gun fingerprint cases were obtained from the IMCFSA
and the IMPD latent fingerprint unit. To establish a set of gun
fingerprint cases as a comparison group, IMPD East District firearm
cases in the year preceding the TriggerPro project (July 1, 2007–
June 30, 2008) were examined to identify cases that had gunrelated evidence items and requests to process fingerprints from
those items. During this period, there were 705 firearm cases in
the East District, and of those, 147 cases had fingerprint-related
requests recorded by IMCFSA. Data on latent fingerprint development and examination requests were extracted from the IMCFSA
LIMS. For cases that produced viable prints, the IMPD fingerprint
unit provided additional information regarding the use of those
prints in identifying individuals.
Analysis
Results of Gun Fingerprinting
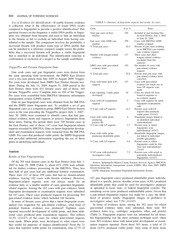
Of the 705 total firearm cases in the East District from July 1,
2007 to June 29, 2008 (Table 1), about 42% (299) were submitted for further evidence processing by the IMCFSA. Thus, less
than half of gun cases had any additional forensic examination.
There were 117 of these 299 cases that had no firearm-related
evidence, leaving 182 cases with firearm evidence. However,
fingerprint-related requests were not always made for an
evidence item, so a smaller number of cases generated fingerprintrelated requests. Among the 182 cases with gun evidence, latent
fingerprint development or examination requests were submitted
for 147 cases. These cases produced requests for processing 503
gun-related evidence items, which included 184 firearms.
In terms of firearm cases, given that a latent fingerprint examination was requested for gun-related evidence, what kind of
potential forensic evidence was produced? Eighteen cases
reported successful development of viable prints, and three additional cases produced print examination requests. This reflects
14.3% (21/147) of the cases for which print-related requests
were made. When prints were developed, to what extent were
they useful for purposes of suspect identification? From the 21
cases that reported viable prints for examination, four (2.7% of
TABLE 1––Summary of fingerprint requests and results, by cases.
Cases
N or %
Total gun cases in East
District
705
Gun cases with LIMS case
number
% Total gun cases
299
Number with nongun-related
evidence
117
LIMS cases with gun-related
evidence items
182
% Total gun cases
Cases with latent print (LP)
requests
Cases reporting “viable prints
developed”
42.4
25.8
147
18
Cases with LP examination
requests
3
% Cases with LP requests
14.3
Cases with viable prints
producing
positive ID
% Cases with LP requests
4
2.7
Cases with viable prints
producing identifiable prints
7
% Cases with LP requests
4.8
% LP cases with probative/
investigative value
7.5
Notes
Included in gun tracking files
for East District, July 1, 2007
to June 29, 2008
Cases with IMCFSA LIMS
number assigned
Percent of gun cases resulting
in an IMCFSA case number
(any evidence request)
These cases had other
nongun-related evidence
(excluded from this
analysis)
Net number of cases with
gun-related evidence
requests
Percent total gun cases with
gun-related evidence items
(182/705)
Cases with gun-related
evidence for which one or
more LP requests were
made
Cases for which LP were
found in response to
an evidence request
Cases with requests for latent
fingerprint examinations
only
Percent cases with LP
requests that produced
viable prints (21/147)
Fingerprint images linked to
an identified individual
(individualized)
Percent cases in which
fingerprints were
individualized (4/147)
Identifiable fingerprint images,
not linked to individual
(IAFIS uploadable)
Percent cases in which
fingerprints could be (but
were not) individualized
(7/147)
Percent cases with actual or
potentially individualized
fingerprints (11/147)
Sources: Indianapolis-Marion County Forensic Services Agency (IMCFSA)
laboratory information management system (LIMS), May–June 2009. IMPD
firearm tracking files.
IAFIS, Integrated Automated Fingerprint Information System.
147 gun fingerprint cases) produced identifiable prints individualized to a specific person. Another seven cases (4.8%) produced
identifiable prints that could be used for investigative purposes
or uploaded to local, state, or federal fingerprint systems. The
remaining seven cases produced unidentifiable prints. Given that
a gun-related fingerprint request was made for a case, the likelihood of positive results (fingerprint images of probative or
investigative value) was 7.5% (11/147).
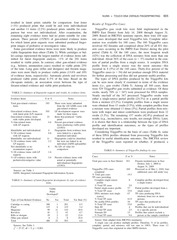
In terms of evidence items, among the 182 cases for which
gun-related evidence items were submitted, there were 583
evidence items (e.g., cartridges, magazines, rifles, and pistols)
(Table 2). Fingerprint requests were not submitted for all items,
but fingerprinting was the most common technique used—there
were 503 evidence items with latent print development or examination requests reported. From these 503 items, a total of 23
items (4.6%) produced viable prints. Only some of these items
�
NUNN
resulted in latent prints suitable for comparison: four items
(<1%) produced prints that could be and were individualized
and another 11 items (2.2%) produced prints suitable for comparison but were not individualized. After examination, the
remaining eight evidence items had no prints suitable for comparison. Three percent (15/503) of gun-related evidence items
for which latent print requests were submitted produced fingerprint images of probative or investigative value.
Some gun-related evidence items were more likely to produce
viable fingerprints than others (Table 3). While cartridges or bullet casings represented the largest number of evidence items submitted for latent fingerprint analysis, <1% of the 201 items
resulted in viable prints. In contrast, other gun-related evidence
(e.g., holsters, ammunition cases) resulted in viable prints 25%
of the time. Long guns (rifles and shotguns) and firearm magazines were more likely to produce viable prints (13.6% and 10%
of evidence items, respectively). Automatic pistols and revolvers
produced viable prints about 4–5% of the time. Based on the
chi-square statistic, an association exists between the type of
firearm-related evidence and viable print production.
TABLE 2––Summary of fingerprint requests and results, by evidence items.
Evidence Items
N or %
Total gun-related evidence
items
583
Gun-related evidence items
with latent print (LP) requests
Gun-related evidence items
with viable prints developed
% Gun-related items
with LP requests
503
Identifiable and individualized
% Of evidence items
with LP requests
Identifiable, not individualized
% Of evidence items with
LP requests
Not identifiable or no
examination request
% Of evidence items with LP
requests
% LP evidence items with
probative/investigative value
23
4.6
4
0.8
11
2.2
8
Notes
These were items submitted
from the 182 LIMS cases with
gun-related evidence
LP development requests were
made for these items
Items that produced “viable
prints”
Percent gun-related evidence
items producing viable prints
(23/503)
Fingerprints from evidence item
were linked to a specific,
identified individual
Fingerprints could be identified,
but were not linked to an
individual (IAFIS uploadable)
No LPs of value for
comparison
Percent evidence items with
actual or potentially
individualized fingerprints
(15/503)
Sources: see Table 1.
IAFIS, Integrated Automated Fingerprint Information System.
TABLE 3––Summary of latent fingerprint development, by type of evidence
items.
Viable
Prints
Developed?
Type of Gun-Related Evidence
No
Yes
Total
Yes Rate (%)
Cartridge or casing
Pistol
Magazine
Revolver
Rifle or shotgun
Other gun related
Total
200
115
99
41
19
6
480
1
4
11
2
3
2
23
201
119
110
43
22
8
503
0.5
3.4
10.0
4.7
13.6
25.0
4.6
Sources: See Table 1.
v2 = 27.27, df = 5, p < 0.001.
TOUCH DNA VERSUS FINGERPRINTING
605
Results of TriggerPro Cases
TriggerPro gun swab kits were field implemented in the
IMPD East District from July 14, 2008 through August 31,
2009. Based on IMCFSA summary reports, there were 164 separate cases developed that used TriggerPro kits. Complete information was available for 160 cases. The 160 TriggerPro cases
involved 182 firearms and comprised about 20% of all 831 firearm cases occurring in the IMPD East District during the pilot
period (Table 4). Of the 160 cases, the most frequent result
(42%) was the collection of DNA mixtures from more than one
individual. About 36% of the cases (n = 57) resulted in the creation of partial profiles from a single source. A complete DNA
profile from a single source was the rarest outcome—this
occurred in 8 (5%) of the 160 cases. Thirty-five percent of the
TriggerPro cases (n = 56) did not produce enough DNA material
for further processing and thus did not generate usable profiles.
The types of DNA profiles produced by the TriggerPro kits
can be seen more clearly if examined in terms of the evidence
items (i.e., gun swabs) (Table 5). Among all 160 cases, there
were 529 TriggerPro gun swabs submitted as evidence. Of these
swabs, nearly 70% (n = 367) were processed for DNA samples.
Nearly one-half of the 367 processed TriggerPro swabs were
either a single-source partial profile (24.3%) or a partial profile
from a mixture (23.2%). Complete profiles from a single source
were obtained from 13 swabs (3.5%), while complete profiles from
a mixture were obtained 11 times (3%). Partial profiles from mixtures with major and minor contributors were produced from 12
swabs (3.3%). The remaining 157 swabs (42.8%) produced no
results (e.g., inconclusive, zero results, not enough DNA). Later,
it is shown that there is a relationship between the type of DNA
profile and identification outcomes, so the types of profiles
developed are important.
Considering TriggerPro on the basis of cases (Table 4), some
of these DNA profiles obtained from processing TriggerPro kits
resulted in useful identification outcomes. The IMCFSA review
of the TriggerPro cases reported on whether, if produced, a
TABLE 4––Summary of TriggerPro findings by case.
1.6
3.0
.
Cases
N or %
Total gun cases in East District
831
TriggerPro (TP) cases
completed
% Total gun cases
TP cases providing
Complete single-source
profile
% Total TP cases
Partial single-source profile
% Total TP cases
DNA mixtures (not single
source)
% Total TP cases
No usable DNA profiles
% Total TP cases
Stats ID
% Total TP cases
Nonstats ID
% Total TP cases
160
Notes
Firearm incident/cases in East
District, July 1, 2008 to
August 31, 2009
Processed as of May 1, 2010; four
additional cases still under way
19.3
8
5.0
57
35.6
67
41.9
56
35.0
4
2.5
15
9.4
Complete profiles developed from
a single source
Partial profiles developed from a
single source
TP cases producing DNA
mixtures from two or more
persons
TP cases that produced no
profiles
Profiles that can be individualized
to a specific person
Profiles that cannot exclude a
person as the sample contributor
Source: Data adapted from IMCFSA summaries.
A single case can produce multiple profiles. Therefore, % of no profiles,
complete, partial, and mixtures will not sum to 100%. There were 13
TriggerPro cases that originated in other IMPD districts.
�
606
JOURNAL OF FORENSIC SCIENCES
DNA profile resulted in any type of suspect identification—a
stats ID in which the chances that anyone else contributed to the
crime scene sample are miniscule or a nonstats ID in which an
individual cannot be excluded as a potential contributor. Four
cases (2.5%) produced stats IDs, and 15 cases (9.4%) produced
nonstats IDs. Thus, nearly 12% of the TriggerPro cases provided
profiles that had probative and investigative value.
Table 6 links the types of DNA profiles developed from TriggerPro cases with the suspect identification outcomes reported.
Cases with various mixture combinations had a higher likelihood
of producing stats or nonstats identifications than the cases that
had various types of single-source profiles. Among the 42 cases
from which gun swabs produced only mixtures, eight of the 15
nonstats identifications and three of the four stats identifications
were developed (these mixtures generally had major/minor
contributors). Based on the chi-square statistic, an association
exists between the type of DNA profile developed and identification outcomes. This seems important because touch DNA methods
like TriggerPro—especially if applied to firearm-related evidence
items—will produce more DNA mixtures that, based on the pilot
project data, can offer potentially useful identification information.
Identification Outcomes: Firearm Fingerprinting Versus
TriggerPro
Comparing gun-related fingerprint cases and evidence items to
TriggerPro cases and evidence items suggests that touch DNA
gun swab methods generate a more sizable quantity of potentially usable forensic evidence (Table 7), but this potential does
not translate into an equally larger number of valued identification outcomes. Nearly two-thirds (104/160) of TriggerPro cases
produced some type of DNA profile. Yet, the much larger
number of TriggerPro cases with profiles did not result in a similarly
larger number of the highest value individualized identifications
(2.5% of gun swab cases vs. 2.7% of fingerprint cases). The
TriggerPro cases produced nonstats identifications (i.e., could
not exclude an individual as the contributor) at about twice the
rate fingerprint cases produced identifiable (but not individualized) fingerprint images (9.4% vs. 4.8%, respectively, but not
statistically different).
In the comparisons of evidence items, about 5% of gun-related
evidence items produced viable fingerprint images, while 57%
of the TriggerPro evidence items (gun swabs) resulted in DNA
TABLE 5––Summary of TriggerPro findings by evidence items (swabs).
Evidence Items
N or %
Total gun swabs used in 160
cases
TP gun swabs
processed
% Total gun swabs used
Gun swabs providing
Complete single-source profile
% Total swabs processed
Partial single-source profile
% Total swabs processed
Complete mixtures
% Total swabs processed
Partial mixtures
% Total swabs processed
Partial mixtures (maj/min)
% Total swabs processed
Other results
% Total swabs processed
529
367
Notes
Sum of gun swabs reported in all
TriggerPro (TP) cases
Sum of gun swabs processed
69.4
13
3.5
89
24.3
11
3.0
85
23.2
12
3.3
157
42.8
TABLE 7––Comparison of fingerprint and TriggerPro findings.
Complete profiles developed from
a single source
Partial profiles developed from a
single source
Complete profiles developed from
mixtures
Partial profiles developed from a
mixture
Partial profiles developed from a
mixture (w/major + minor)
Inconclusive results, zero results,
not enough DNA, etc.
Source: Data adapted from IMCFSA summaries, March 11, 2010.
Maj/Min refers to major and minor contributors. % total swabs processed
might not add to 100% due to rounding.
Fingerprint
Cases
Evidence Items
Total cases with forensic requests
Cases producing
Viable fingerprint images or DNA profiles
% Total cases
Positive ID or stats ID
% Total cases
Identifiable prints or nonstats ID
% Total cases
Total evidence items processed
Evidence items producing
Viable fingerprint images or DNA profiles
% Total evidence items
Positive ID or stats ID
% Total evidence items
Identifiable prints or nonstats ID
% Total evidence items
TriggerPro
Cases
147
160
21
14.3
4
2.7
7
4.8
503
104
*65.0
4
2.5
15
9.4
367
23
4.6
4
0.8
11
2.2
210
*57.2
4
1.1
15
4.1
DNA profiles include cases resulting in single-source or mixture-based
profiles of any type. Positive ID refers to fingerprint images that are
individualized.
*Difference in proportions z-score, p < 0.001.
TABLE 6––Types of DNA profiles produced by TriggerPro cases and suspect identification outcomes.
Suspect Identification
Profiles Produced in TriggerPro Cases
Single-source complete + single-source partial
Single-source partial
Single-source complete
No profiles
Mixture + single-source partial
Mixture + single-source complete
Mixture only
Totals
No ID Information
Nonstats ID
Stats ID
Total
% Total = Stats or Nonstats ID
3
28
3
56
19
1
31
141
–
3
–
–
–
–
4
–
8
15
–
1
3
4
3
31
3
56
23
2
42
160
0
9.7
0
0
17.4
50.0
26.2
11.9
Source: IMCFSA summary reports, March 11, 2010.
A single case can produce multiple profiles. Table cells indicate the number of cases that produced one or more profiles of the types described in the first
column on the left. For example, the first line shows that three cases produced at least one single-source complete profile and one single-source partial profile,
but none of the three cases resulted in a stats or nonstats ID.
v2 = 38.74, df = 12, p < 0.001.
�
NUNN
profiles (z-score p < 0.001). However, the vast majority of those
profiles had no identification value for the current cases,
although it is possible that they could help with future DNA
searches in forensic databases. As a proportion of total evidence
items, the most valued identification outcomes were produced by
3% of gun-related fingerprint evidence and 5.2% of TriggerPro
evidence, statistically insignificant differences.
Discussion and Implications
This analysis focused on only two of the various approaches
to firearm processing: touch DNA and fingerprinting. A full
accounting of forensic firearm processing impacts would include
outcomes linked to serial number reviews and test firing results
to determine whether they produce hits from other firearm and
ballistics databases. Setting those broader outcomes aside, the
final sections discuss findings and their implications for forensic
science.
Quantity and Use of Forensic Evidence Produced
If considered as the baseline method, fingerprinting firearms
had perhaps a higher rate of viable print production than originally suspected (mostly based on anecdotal stories, with few
previous studies reporting the fingerprint productivity of firearmrelated evidence). About one in five gun cases (147 of 705)
resulted in requests for latent print development. If investigators
asked for prints, viable prints were generated in 14.3% of the
cases. Of the 147 gun cases with print requests, 7.5% (11 cases)
produced suitable images that either were or could be individualized. TriggerPro produced more potentially useful evidence than
firearm fingerprinting—but just because a DNA profile was
developed did not mean it had any value for identification purposes. The TriggerPro kits collected a substantial amount of
DNA material (i.e., the sum of single-source DNA samples and
DNA mixtures). Measured this way, 57% of gun swab evidence
items, or 65% of TriggerPro cases, generated DNA profiles.
Identification Outcomes
The TriggerPro touch DNA cases fared only somewhat better
than fingerprint cases when considering identification results.
Despite the larger quantity of DNA material collected with TriggerPro gun swabs, identification outcomes between the two
methods were similar. The higher volume of forensic evidence
collected by TriggerPro kits did not translate into a larger number of identifications than gun fingerprinting. The incidence of
positive identifications in the two groups was equivalent—
fingerprinted items yielded a 0.8% rate (4/503 items), compared
to a 1.1% rate for gun swabs (4/367 items)—not a significant
difference. The sample of firearm fingerprint cases produced 11
identifiable (though not individualized) fingerprints, while the
TriggerPro gun swab cases produced 15 additional DNA profiles
capable of including or excluding the suspect’s reference sample
(i.e., nonstats IDs). The rate of success among fingerprint
evidence items and DNA evidence items was not statistically
different.
Implications for Forensics and Policing
The TriggerPro evaluation raises various questions about
police use of touch DNA, forensic processing of firearms, and
the use of different evidence collection approaches. For example,
.
TOUCH DNA VERSUS FINGERPRINTING
607
who collects DNA—the responding police patrol officer or some
other party? The TriggerPro kit was designed for deployment in
the field by patrol officers and evidence technicians (sworn or
civilian). This analysis offered little insight into the issue of
whether prepackaged touch DNA kits should be utilized by a
responding patrol officer or better left to evidence technicians or
other crime scene specialists. Police patrol officers might be
more effective if they are not asked to use touch DNA evidence
collection kits and instead deployed more quickly to the next
run. Police patrol use of touch DNA reflects an implicit decision
that the marginal benefits of DNA collection are greater than
that of additional patrol resources made available if touch DNA
is not used by officers.
Nevertheless, if prepackaged kits such as TriggerPro were
implemented routinely in police patrol, the pattern of their use
would change, based on judgments about the circumstances
under which touch DNA evidence is best acquired. As a pilot,
one objective of the TriggerPro project was to swab as many
guns as possible in as short a time as possible to assess the
effectiveness of the kits in collecting human cell samples. Firearms might have been swabbed during the pilot that would not
have been swabbed under normal circumstances (e.g., gun taken
directly from an individual’s pocket). It was also clear that many
firearms recovered in the East District during the pilot period
were not swabbed—TriggerPro cases were only about 20% of
all East District firearm incidents during the time period of the
pilot project. (In comparison, firearm fingerprint requests were
about 20% of the IMPD East District firearm cases in the previous year.) Thus, the findings for this pilot cannot be broadly
generalized.
Another question involves choices patrol officers or evidence
technicians must make when processing crime scene evidence.
What items should be submitted for further forensic processing?
For fingerprinting requests, the type and amount of evidence
mattered (e.g., cartridges vs. rifles vs. handguns), but this question was not examined in the TriggerPro cases. Trigger Pro evidence items were by definition swabs, and the locations from
which swab samples were taken (e.g., barrel, grip, hammer, cartridge, holster, etc.) were not reported in the LIMS data. Some
parts of a firearm might be more or less likely than others to
produce viable DNA samples. A recent analysis of firearm DNA
swabbing by the Illinois State Police found grips and slides to
be the most productive sources (as measured by average number
of loci profiled) (29).
A last set of issues concerns the comparative effectiveness of
touch DNA swabs versus fingerprint approaches in terms of time
required and costs involved to complete full forensic processing.
The more complex scientific processing associated with developing and analyzing DNA samples—in comparison with developing or examining latent fingerprint images—means DNA-related
evidence requests are likely to take longer to complete and be
more expensive than fingerprint-related requests. In calendar
year 2009, the IMCFSA turnaround time for latent fingerprint
processing was 43.2 days, compared to 72 days for DNA
processing (30). In an investigative sense, police and prosecutors
would obtain fingerprint evidence back sooner than they would
receive DNA evidence. If there is little difference in identification outcomes, the longer time period required and higher
implied costs of touch DNA processing might suggest more
emphasis on firearm fingerprinting as the most cost-effective
technique. Accordingly, both the time element and costs associated with touch DNA evidence processing deserve more detailed
analysis before widespread adoption. Overall, more analyses are
�
608
JOURNAL OF FORENSIC SCIENCES
needed of touch DNA use by police and forensic agencies within
different operating environments to develop a better understanding of its effectiveness under different operating circumstances
and in comparison with other forensic methods.
References
1. Wickenheiser RA. Trace DNA: a review, discussion of theory, and application of the transfer of trace quantities of DNA through skin contact.
J Forensic Sci 2002;47(3):442–50.
2. Raymond JJ, Walsh SJ, Van Oorschot RA, Gunn PR, Roux C. Trace
DNA: an underutilized resource or Pandora’s Box? A review of the use
of trace DNA analysis in the investigation of volume crime J Forensic
Identi 2004;54(6):668–86.
3. Lazar D, editor. DNA and the criminal justice system: the technology of
justice. Cambridge, MA: MIT Press, 2004.
4. Bond JW. Value of DNA evidence in detecting crime. J Forensic Sci
2007;52(1):128–36.
5. Bond J, Hammond C. The value of DNA material recovered from crime
scenes. J Forensic Sci 2008;53(4):797–801.
6. Houck M, Houck L. What is touch DNA? Sci Am, 2008, http://www.
scientificamerican.com/article.cfm?id=experts-touch-dna-jonbenet-ramsey
(accessed February 10, 2012).
7. Raymond JJ, Van Oorschot RA, Gunn PR, Walsh SJ, Roux C. Trace
DNA success rates relating to volume crime offenses. Forensic Sci Int:
Genetic Supplements Series 2009;2(1):136–7.
8. Raymond JJ, Van Oorschot RA, Walsh SJ, Roux C, Gunn PR. Trace
DNA and street robbery: a criminalistic approach to DNA evidence.
Forensic Sci Int: Genetic Supplements Series 2009;2(1):544–6.
9. Roman JK, Reid S, Reid J, Chalfin A, Adams W, Knight C. The DNA
field experiment: cost-effectiveness analysis of the use of DNA in the
investigation of high-volume crimes. Washington, DC: Urban Institute,
Justice Policy Center, 2008.
10. Zedlewski E, Murphy MB. DNA analysis for ‘minor’ crimes: a major
benefit for law enforcement. NIJ J 2006;253:2–6.
11. Bond JW, Sheridan L. The relationship between the detection of acquisitive crime by forensic science and drug-dependent offenders. J Forensic
Sci 2007;52(5):1122–8.
12. Horsman-Hall KM, Orihuela Y, Karczynski SL, Davis AL, Ban JD,
Greenspoon SA. Development of STR profiles from firearms and fired
cartridge cases. Forensic Sci Int: Genetics 2009;3(4):242–50.
13. Wilson DB, Weisburd D, McClure D. Use of DNA testing in police
investigative work for increasing offender identification, arrest, conviction and case clearance. Campbell Syst Rev 2011;7(7), doi:10.4073/csr.
2011.7 http://campbellcollaboration.org/lib/project/126/ (accessed January
31, 2013).
14. National Academy of Sciences. Strengthening forensic science in the
United States: a path forward. Washington, DC: National Academies
Press, 2009.
15. Griswold ME, Murphy GR. It’s more complex than you think: a chief’s
guide to DNA. Police Executive Research Forum. Washington, DC: Office
of Community Oriented Policing Services, US Department of Justice,
2010.
16. McCartney C. LCN DNA: proof beyond reasonable doubt? Nat Rev:
Genetics 2008;9(5):325.
17. Ladd C, Adamowicz MS, Bourke MT, Scherczinger CA, Lee HC. A systematic analysis of secondary DNA transfer. J Forensic Sci 1999;44
(6):1270–2.
18. Wulff PH. Low copy number DNA: reality vs. jury expectations. Silent
Witness 2006;10(3):4.
19. Saferstein R. Criminalistics: an introduction to forensic science, 9th edn.
Upper Saddle River, NJ: Pearson/Prentice-Hall, 2007.
20. Bellefeuille J, Bowen K, Dixon P, Hanniman J, Hillier E, Lama D, et al.
Crime scene DNA collection: research and practical considerations.
J Forensic Ident 2003;53(6):729–34.
21. Given BW. Latent fingerprints on cartridges and expended cartridge
casings. J Forensic Sci 1976;21:587–94.
22. Bell S. The facts on file dictionary of forensic science. New York, NY:
Facts on File, Inc., 2004.
23. DNA Initiative. Glossary, 2010, http://www.dna.gov/more/glossary
(accessed February 10, 2012).
24. Thompson WC, Ford S, Doom T, Raymer M, Krane DE. Evaluating
forensic DNA evidence: essential elements of a competent defense
review. The Champion 2003;27(3):16–25.
25. Budowle B, Moretti TR, Baumstark AL, Defenbaugh DA, Keys KM.
Population data on the thirteen CODIS core short tandem repeat loci in
African Americans, U.S. Caucasians, Hispanics, Bahamians, Jamaicans,
and Trinidadians. J Forensic Sci 1999;44(6):1277–86.
26. Budowle B, Chakraborty R, Carmody G, Monson KL. Source attribution
of a forensic DNA profile. Forensic Sci Commun 2000;2(3):6.
27. Kaye DH. Trawling DNA databases for partial matches: what is the FBI
afraid of? J Law Public Policy 2009;19(1):145–71.
28. Song YS, Patil A, Murphy EE, Slatkin M. Average probability that a
“cold hit” in a DNA database search results in an erroneous attribution.
J Forensic Sci 2009;54(1):22–7.
29. Richert NJ. Swabbing firearms for handler’s DNA. J Forensic Sci
2011;56(4):972–5.
30. Indianapolis-Marion County Forensic Services Agency. Turnaround time
by section. Agency case statistics Jan 2009 through April 2010. Indianapolis, IN: Indianapolis-Marion County Forensic Services Agency, 2010.
Additional information and reprint requests:
Samuel Nunn, Ph.D.
Professor, School of Public and Environmental Affair (SPEA)
Director, Center for Criminal Justice Research (CCJR)
Indiana University – Purdue University Indianapolis
801 West Michigan Street
Indianapolis, IN 46202-5152
E-mail: snunn@iupui.edu
�
 Historical archive . public document