1314 ReportCard 1186 (1) (PDF)
File information
Title: Summary
Author: Oregon Department of Education
This PDF 1.4 document has been generated by Oregon Department of Education / DynamicPDF for .NET v7.0.1.40 (Build 23023), and has been sent on pdf-archive.com on 24/04/2015 at 01:10, from IP address 50.198.x.x.
The current document download page has been viewed 526 times.
File size: 382.4 KB (4 pages).
Privacy: public file


File preview
OREGON
REPORT CARD
201314
Aloha High School
DISTRICT Beaverton SD 48J
SUPERINTENDENT Jeff Rose
PRINCIPAL Ken Yarnell
GRADES SERVED 912
18550 SW Kinnaman Rd
Beaverton, OR 97007 (503) 2594700
www.beaverton.k12.or.us/aloha/home.html
For more report card measures
including detailed demographic
information visit
www.ode.state.or.us/go/RCMeasures
FROM THE PRINCIPAL
Dear Parents and Community Members,
We are committed to regular communication with parents and the
community about our school. Toward that goal, here is our school
report card, produced by the Oregon Department of Education.
In the 20132014 school year, our school received an Overall
State Rating of Level 3. This means the achievement and growth
on standardsbased tests and graduation rates of our students
are below average.
Please turn the page to see how our students are doing on tests,
programs and experiences available to our students, and student
survey data. To see the strategies we are implementing this year
to improve student achievement, please review our school
improvement plan posted on our website.
You can help us help your child on the path to graduating with
many options for post high school learning by having high
expectations for your student, providing a home that is conducive
to learning, and ensuring your child is at school every day ready
to learn.
Thank you for your support and involvement in our students’
success.
Thank you,
Principal | Ken Yarnell
SCHOOL PROFILE
STUDENTS
Enrollment 201314
Change from previous year
Students attending 90% or more
of enrolled days
1,945
0.9%
79.4%
Select Demographics 201314
English Learners
OVERALL STATE RATING
32%
American Indian/
Alaska Native 1%
Students who have ever been eligible for or
participated in a program to acquire academic
English.
Economically disadvantaged
Students with disabilities
Note: a ‘*’ is displayed when the data must be suppressed
to protect student confidentiality.
White 46%
Native Hawaiian/
Pacific Islander 1%
Black/
African American 4%
60%
17%
MultiRacial 7%
Asian 7%
Hispanic/Latino 34%
Number of different languages spoken: 37
HOW ARE STUDENTS AT THIS SCHOOL PERFORMING COMPARED TO THOSE AT OTHER SCHOOLS?
The overall state rating is intended to summarize this school's particular successes and challenges. It is based on a combination of up
to five factors. Three of these factors come from standardized test scores in reading and math: student achievement, student growth,
and the growth of underserved subgroups. High schools are also rated on the overall graduation rate for the school and the graduation
rates of underserved subgroups. Please be aware that this rating is based mainly on highstakes testing and accordingly, represents a
limited view of student performance. Other aspects of this report card are designed to put this rating in the proper context.
Compared to all schools statewide in 201314,
this school is rated as Level 3.
Compared to high schools with similar student demographics in
201314, this school‘s rating is about average.
State Average
Level 1
Level 2
Level 3
Level 4
Level 1 = Falls into the bottom 5% of schools
Level 2 = Falls between 5% and 15% of schools
Level 3 = Falls between 15% and 44% of schools
Level 4 = Falls between 44% and 90% of schools
Level 5 = Falls into the top 10% of schools
Level 5
Below Average
About Average
Above Average
Below average = Falls into the bottom third of comparison schools
About average = Falls into the middle third of comparison schools
Above average = Falls into the top third of comparison schools
OREGON
REPORT CARD
201314
Aloha High School
DISTRICT Beaverton SD 48J
SUPERINTENDENT Jeff Rose
PRINCIPAL Ken Yarnell
GRADES SERVED 912
18550 SW Kinnaman Rd
Beaverton, OR 97007 (503) 2594700
www.beaverton.k12.or.us/aloha/home.html
PROGRESS
For more report card measures
including detailed demographic
information visit
www.ode.state.or.us/go/RCMeasures
ARE STUDENTS MAKING ADEQUATE GAINS OVER TIME?
Performance of students enrolled in the school for a full academic year
SCHOOL
PERFORMANCE Did at least 95% of the students at this school take required assesments?
Yes
No
Participation rate criteria are in place to ensure schools test as many eligible students as possible
School Performance (%)
Reading
201011
82.0
Note new cut scores in 201112.
12.2
69.8
18.0
65.4
82.7
9.5
55.9
34.6
56.6
12.4
70.3
17.3
81.0
Did not meet
4.8
51.8
43.4
64.5
5.1
59.3
35.5
63.2
Did not meet
80.5
64.9
Note new cut scores in 201112.
3.5
77.0
19.5
15.8
49.2
35.1
Visit www.ode.state.or.us/go/data for additional assessment results.
COLLEGE
AND
CAREER
READINESS
9.1
71.1
19.8
77.9
1.1
76.8
22.1
62.2
59.5
2.1
60.1
37.8
56.8
Did not meet
(Administered statewide in Grades: 5, 8, 11)
All students in tested grades
OUTCOMES
80.2
(Tested Grade: 11)
All students in tested grades
Science
Did not meet
(Administered statewide in grades: 38, 11)
All students in tested grades
Writing
201213
(Administered statewide in grades: 38, 11)
All students in tested grades
Mathematics
201112
School
Oregon
Performance (%) Performance (%)
201314
201314
9.5
50.0
40.5
60.2
6.0
54.2
39.8
>95
Met
LikeSchool
Average (%)
201314
Exceeded
13.5
67.5
19.0
85.6
Met
25.8
59.8
14.4
82.3
15.8
66.5
17.7
Exceeded
5.3
57.9
36.8
71.3
Met
8.4
62.9
28.7
68.2
4.1
64.2
31.8
Exceeded
4.8
52.0
43.2
61.3
Met
6.1
55.2
38.7
53.8
4.0
49.8
46.2
Exceeded
*
*
<5
63.1
9.4
53.6
36.9
53.4
6.4
47.0
46.6
Note: a ‘*’ is displayed when data are unavailable or to protect student confidentiality.
WHAT ARE STUDENTS ACHIEVING IN HIGH SCHOOL?
Students preparing for college and careers.
School
Performance (%)
201011 201112 201213
NA
29.1
Freshmen on track to graduate within 4 years
Students taking SAT
NA
31.5
NA
18.0
School
Performance (%)
200910 201011 201112
School
Oregon
Performance (%) Performance (%)
201314
201314
71.5
17.7
78.5
33.3
School
Oregon
Performance (%) Performance (%)
201213
201213
GRADUATION Students graduating with a regular diploma within four years of entering high school.
RATE
Overall graduation rate
71.2 72.3 72.7
67.9
68.7
LikeSchool
Average (%)
201314
75.2
28.9
LikeSchool
Average (%)
201213
68.0
COMPLETION Students receiving a regular, modified, extended, or adult high school diploma or completing a GED within five
RATE
years of entering high school.
Overall completion rate
DROPOUT
RATE
79.6
81.2
82.6
81.5
73.8
3.2
4.0
2.4
Students who dropped out during the school year and did not reenroll.
Overall dropout rate
1.9
Note: Dropout methodology change in 201213.
CONTINUING
EDUCATION
84.3
1.6
3.8
School
Performance (%)
200809 200910 201011
Students continuing their education after high school.
Students who enrolled in a community college or fouryear
school within 16 months of graduation
64.3
66.1
60.8
School
Oregon
Performance (%) Performance (%)
201112
201112
64.8
54.7
LikeSchool
Average (%)
201112
56.7
Note: a ‘*’ is displayed when the data must be suppressed to protect student confidentiality.
OREGON
REPORT CARD
201314
Aloha High School
DISTRICT Beaverton SD 48J
SUPERINTENDENT Jeff Rose
PRINCIPAL Ken Yarnell
GRADES SERVED 912
18550 SW Kinnaman Rd
Beaverton, OR 97007 (503) 2594700
www.beaverton.k12.or.us/aloha/home.html
For more report card measures
including detailed demographic
information visit
www.ode.state.or.us/go/RCMeasures
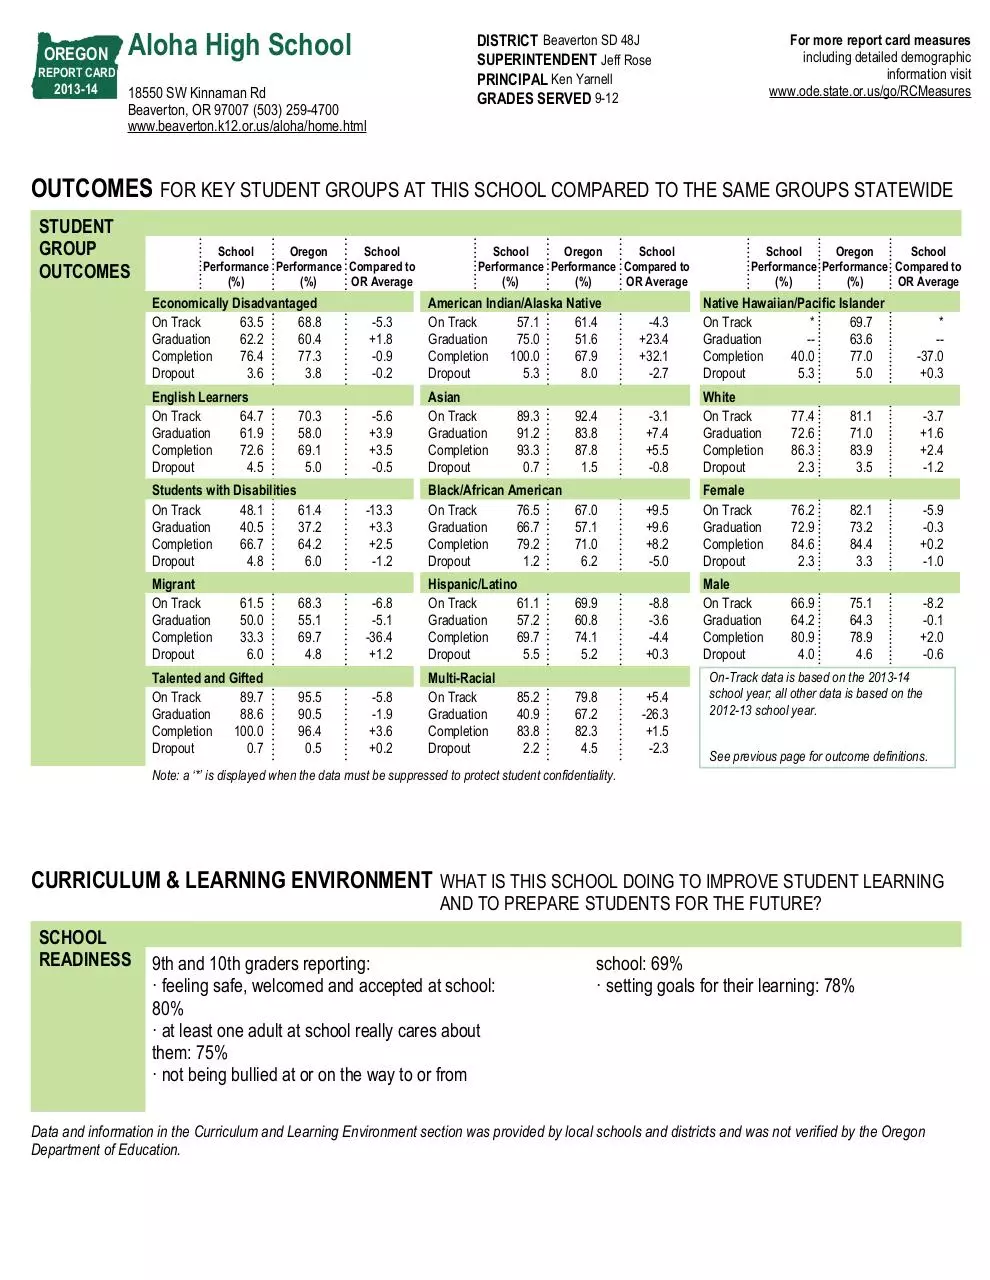
OUTCOMES FOR KEY STUDENT GROUPS AT THIS SCHOOL COMPARED TO THE SAME GROUPS STATEWIDE
STUDENT
GROUP
OUTCOMES
School
Oregon
School
Performance Performance Compared to
(%)
(%)
OR Average
School
Oregon
School
Performance Performance Compared to
(%)
(%)
OR Average
Economically Disadvantaged
63.5
68.8
On Track
62.2
60.4
Graduation
76.4
77.3
Completion
3.6
3.8
Dropout
5.3
+1.8
0.9
0.2
American Indian/Alaska Native
57.1
61.4
On Track
75.0
51.6
Graduation
67.9
Completion 100.0
5.3
8.0
Dropout
English Learners
64.7
On Track
61.9
Graduation
Completion
72.6
Dropout
4.5
70.3
58.0
69.1
5.0
5.6
+3.9
+3.5
0.5
Asian
On Track
Graduation
Completion
Dropout
92.4
83.8
87.8
1.5
Students with Disabilities
On Track
48.1
61.4
Graduation
40.5
37.2
Completion
66.7
64.2
Dropout
4.8
6.0
13.3
+3.3
+2.5
1.2
Migrant
On Track
Graduation
Completion
Dropout
School
Oregon
School
Performance Performance Compared to
(%)
(%)
OR Average
Native Hawaiian/Pacific Islander
*
69.7
On Track
63.6
Graduation
40.0
77.0
Completion
5.3
5.0
Dropout
*
37.0
+0.3
3.1
+7.4
+5.5
0.8
White
On Track
Graduation
Completion
Dropout
77.4
72.6
86.3
2.3
81.1
71.0
83.9
3.5
3.7
+1.6
+2.4
1.2
Black/African American
On Track
76.5
67.0
Graduation
66.7
57.1
Completion
79.2
71.0
Dropout
1.2
6.2
+9.5
+9.6
+8.2
5.0
Female
On Track
Graduation
Completion
Dropout
76.2
72.9
84.6
2.3
82.1
73.2
84.4
3.3
5.9
0.3
+0.2
1.0
Male
On Track
Graduation
Completion
Dropout
66.9
64.2
80.9
4.0
75.1
64.3
78.9
4.6
8.2
0.1
+2.0
0.6
89.3
91.2
93.3
0.7
4.3
+23.4
+32.1
2.7
61.5
50.0
33.3
6.0
68.3
55.1
69.7
4.8
6.8
5.1
36.4
+1.2
Hispanic/Latino
On Track
61.1
Graduation
57.2
Completion
69.7
Dropout
5.5
69.9
60.8
74.1
5.2
8.8
3.6
4.4
+0.3
Talented and Gifted
On Track
89.7
Graduation
88.6
Completion 100.0
Dropout
0.7
95.5
90.5
96.4
0.5
5.8
1.9
+3.6
+0.2
MultiRacial
On Track
Graduation
Completion
Dropout
79.8
67.2
82.3
4.5
+5.4
26.3
+1.5
2.3
85.2
40.9
83.8
2.2
Note: a ‘*’ is displayed when the data must be suppressed to protect student confidentiality.
OnTrack data is based on the 201314
school year; all other data is based on the
201213 school year.
See previous page for outcome definitions.
CURRICULUM & LEARNING ENVIRONMENT WHAT IS THIS SCHOOL DOING TO IMPROVE STUDENT LEARNING
AND TO PREPARE STUDENTS FOR THE FUTURE?
SCHOOL
READINESS
9th and 10th graders reporting:
· feeling safe, welcomed and accepted at school:
80%
· at least one adult at school really cares about
them: 75%
· not being bullied at or on the way to or from
school: 69%
· setting goals for their learning: 78%
Data and information in the Curriculum and Learning Environment section was provided by local schools and districts and was not verified by the Oregon
Department of Education.
OREGON
REPORT CARD
201314
Aloha High School
18550 SW Kinnaman Rd
Beaverton, OR 97007 (503) 2594700
www.beaverton.k12.or.us/aloha/home.html
DISTRICT Beaverton SD 48J
SUPERINTENDENT Jeff Rose
PRINCIPAL Ken Yarnell
GRADES SERVED 912
For more report card measures
including detailed demographic
information visit
www.ode.state.or.us/go/RCMeasures
CURRICULUM & LEARNING ENVIRONMENT CONTINUED . . .
ACADEMIC SUPPORT
· ELL program, special education services,
Talented and Gifted program
· Education Plan and Profile, Advisory, AVID
· College and Career Center, Link Crew
· 9th grade math and science intervention
classes
CAREER & TECHNICAL EDUCATION
Career Pathways in Architectural
Drafting/Construction, Automotive Technology,
and Marketing.
79% of CTE Concentrators earned a regular
diploma in 201213.
ACADEMIC ENRICHMENT
WORLD LANGUAGE COURSES
Spanish, French, German, Japanese
HONORS & DUALENROLLMENT
COURSES
· Advanced Placement (AP)
· Dual credit courses (contact school)
SPECIAL PROGRAMS
· 80% of 11th graders take ACT
· 10th graders college ready on PLAN test:
Reading 39%, Math 36%, Science 39%
· 9th grade academy
EXTRACURRICULAR ACTIVITIES
9th and 10th graders reporting:
· participating in at least one extracurricular
activity: 73%
See school website for activities available to
students.
Data and information in the Curriculum and Learning Environment section was provided by local schools and districts and was not verified by the Oregon
Department of Education.
Download 1314-ReportCard-1186 (1)
1314-ReportCard-1186 (1).pdf (PDF, 382.4 KB)
Download PDF
Share this file on social networks
Link to this page
Permanent link
Use the permanent link to the download page to share your document on Facebook, Twitter, LinkedIn, or directly with a contact by e-Mail, Messenger, Whatsapp, Line..
Short link
Use the short link to share your document on Twitter or by text message (SMS)
HTML Code
Copy the following HTML code to share your document on a Website or Blog
QR Code to this page

This file has been shared publicly by a user of PDF Archive.
Document ID: 0000222602.