The first statistically and demographically
representative measure of all US audio,
across all formats, genres and devices.
Prepared by AudienceNet
audiencenet.co.uk
Fieldwork conducted
February 2015
Sample 3,198
respondents
(US nat. rep.)
1
AUDIOMONITOR USA
MAY
2015
�
04
06
3
2
AUDIOMONITOR // MAY 2015
CONTENTS
10
12
13
14
INTRODUCTION
06 SHARE OF EAR
10 REACH
12 MUSIC DISCOVERY
13 CURATED LISTENING
14 MUSIC SPENDING
by Robert Delmonte
Music Industry Analyst
AudienceNet
06 CHANGING
CONSUMER HABITS
10 US AUDIO WEEKLY
REACH NETS
12 MUSIC DISCOVERY
TOP 10
06 SHARE OF EAR BY AGE
07 SHARE OF EAR NETS
10 WEEKLY REACH:
15-19 YEAR OLDS
12 TOP MEANS OF
DISCOVERY BY AGE
13 SELF SELECTED VS
CURATED LEAN BACK
LISTENING
14
08 TOP PLATFORM
SHARE OF EAR
11 WEEKLY REACH
BY PLATFORM
15 PAID/PREMIUM
SUBSCRIPTIONS TO
MUSIC STREAMING
SERVICES
09 PLATFORM SHARE
OF EAR
16
16 DEVICES
16 SCREENAGERS OPT
FOR INTERACTIVE
DEVICES
16 BRAND OF CELLPHONE/
SMARTPHONE USED
TO LISTEN TO AUDIO
17 AUDIO CONSUMPTION
DEVICES BY SHARE
OF EAR
18
18 ATTITUDES TO
SOUND QUALITY
FREEMIUM: IS IT
CONVERTING ENOUGH
USERS INTO PAYING
SUBSCRIBERS?
20
22
20 MUSIC GENRES
22 BRAND ADVOCACY
20 THE GENRE AGNOSTIC
YOUTH WANT TRACKS,
NOT GENRES
22 MUSIC AND BRANDS:
THE PERFECT MATCH
20 GENRES (% LIKED)
23 BRAND ADVOCACY
24
24 MUSIC & VIDEO
SERVICES
24 SERVICE USAGE
& AWARENESS
26
26 CONTACT US
Full report available at:
audiencenet.co.uk/audiomonitor
�
5
4
A shift in power has occurred over the past
AUDIOMONITOR // MAY 2015
decade, from supplier to consumer, as the
digitization of music has put consumers in control of
how they access and consume music. Historically,
in the physical world, it was record labels or
radio stations who dictated what music was
made available for consumption, and how
it was consumed. Music fans would have
to wait for their favourite tracks to
INTRODUCTION
MAY 2015
come on the radio or wait for a CD
to be released and pay a price set
by the retailer or not receive
any music at all. Essentially,
because of the digital age,
the consumer has shaken
off
the
shackles
of
conglomerate control
and
decided
to
listen to music
on their own.
Today, consumers can listen to any music they want,
Cutting through the noise of the plethora of
at any time, in any place and in any format, whether
individual platform user data and tailored research
it be downloads, illegal downloads, radio, streaming,
publications, Audiomonitor is a truly democratic
CD’s or vinyl and, importantly, that privilege costs
measure of all audio consumption in the US. It
far less than it used to, if it costs anything at all.
allows all facets of the radio and music industries to
Crucially, the free reign that consumers have over
study and understand the significance and impact of
how they access and consume music means that the
these changes and how they may reshape the music
music industry is becoming consumer driven – it is
industry’s macro-environment. It is, therefore, an
subject to consumers’ consumption habits and no
invaluable tool necessary for any company or person
one but the audience dictates what music is popular
operating within the music industry, and the US
and successful. As a result, all operating within
creative industries at large.
music, from management to publishing, must keep
their finger on the pulse of the constant changes and
ROBERT DELMONTE
fluctuations in consumer audio consumption, and
Music Industry Analyst
how they impact the industry as a whole, in order to
find success.
�
7
6
AUDIOMONITOR // MAY 2015
SHARE
OF EAR
CHANGING CONSUMER
HABITS
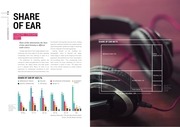
Share of Ear demonstrates the share
of time spent listening to different
audio sources
Younger generations have readily adopted music
has resulted in the way they consume music, shifting
away from traditional methods, thus explaining their
significantly greater uptake and usage of streaming
services compared to the older age groups.
Looking
forward,
as
starts
to
the
‘analogue
demographic
considerably more time listening to audio on a
natives begin to make up the majority of the adult
streaming platform than to broadcast radio.
population, their preference for music consumption
will accompany them.
diminish
and
era’
streaming, with those aged 15-24 years spending
This preference for streaming signifies the
SHARE OF EAR NETS
digital
BROADCAST RADIO | 45%
DIGITAL
DOWNLOAD | 9%
This, consequently, could
coming of a whole new generation of online music
spell success for music streaming, as a form of
consumers, the ‘digital natives’ who have grown
consumption, in years to come – the impact this
up in a digitized world. Music, for them, is an
has on the creative industry as a whole, however,
experience, an omnipresent soundtrack to their
remains to be seen.
daily lives and interactive social environments. This
PHYSICAL | 4%
SHARE OF EAR BY AGE (%)
BROADCAST RADIO
ONLINE
ON DEMAND STREAMING
DIGITAL DOWNLOAD
PHYSICAL
MUSIC TV
INTERNET
RADIO
MUSIC TV | 4%
53
OTHER ONLINE | 2%
36
44
4242
38
ALL ONLINE STREAMING | 38%
40
33 33
24
22
Base: 2,692
respondents (all
those who listened
to any audio
yesterday)
25
21
17
15
14
4 4
2 1
15-19
24
16
11
9
TOTAL
INTERNET RADIO | 14%
61
58
45
ON DEMAND STREAMING | 22%
20-24
14
10
2
1 1
25-34
20
4
7
35-49
4 5
6
10
5
8
6
50+
Broadcast Radio Net = FM, AM, HD & Satellite Radio
Online = All URL Based Listening
Base: 2,692
respondents (all
those who listened
to any audio
yesterday)
�
9
8
Total
CD | 3.7%
DIGITAL
DOWNLOAD
SERVICE
6.6%
14.4%
Total
YouTube (Audio) | 4.9%
INTERNET
RADIO
SERVICE
3.6%
13.2%
4.9%
10.7%
PHYSICAL
MUSIC
OTHER
YouTube & Facebook
Spotify | 3.6%
listening was filtered
by use for audio only
(i.e not watching
accompanying video)
15-19
Music as digital files | 3.0%
iTunes | 2.6%
iHeart Radio | 2.3%
15-19
03
04
05
06
07
08
09
10
Pandora | 6.6%
ON DEMAND
STREAMING
Total
01
02
PLATFORM SHARE OF EAR: TOTAL VS 15-19 YEAR OLDS
15-19
AUDIOMONITOR // MAY 2015
TOP PLATFORM SHARE OF EAR
TV Music Channels | 1.8%
Facebook (Audio) | 1.6%
Amazon Prime | 1.4%
Base: 2,692
respondents (all
those who listened
to any audio
yesterday)
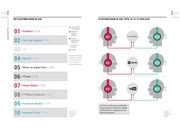
15-19 year olds spent considerably
longer listening to Pandora, Spotify
and YouTube in comparison to the
general population.
Base: 2,692
respondents (all
those who listened
to any audio
yesterday)
�
11
10
AUDIOMONITOR // MAY 2015
REACH
US AUDIO WEEKLY REACH NETS
82 57 44
44 29 24
WEEKLY REACH: 15-19 YEAR OLDS
WEEKLY REACH BY PLATFORM
%
FM/AM RADIO
%
ONLINE LISTENING (TOTAL)
%
ON DEMAND STREAMING
INTERNET RADIO
86%
US AUDIO WEEKLY REACH
NETS: Question 1 & 2: Which,
if any, of the following have you
used in order to listen to audio
content (music or speech) for
five minutes or more at any
one time during the last seven
days? (Nets)
Base: 3,198 respondents (US
nat. rep. sample)
73%
67%
22%
PHYSICAL
MUSIC
DIGITAL DOWNLOADS
INTERNET RADIO
ON-DEMAND STREAMING
45%
FM/AM RADIO
Consumption of physical music was
fairly similar across all age groups.
77%
ONLINE LISTENING (TOTAL)
Males and the younger generations,
particularly the 15-19 and 20-24
year old ‘digital natives’, recorded
significantly higher levels of
streaming consumption.
%
01
02
03
04
05
%
DIGITAL DOWNLOAD
Pandora | 26%
CD | 23%
YouTube (Audio) | 20%
iTunes | 16%
Spotify | 12%
%
PHYSICAL MUSIC
06
07
08
09
10
iHeart Radio | 11%
Music as digital files | 11%
Amazon Prime Music | 8%
TV Music Channels | 7%
iTunes Radio | 6%
�
CURATED
LISTENING
MUSIC DISCOVERY TOP 10
01
02
03
04
05
SELF SELECTED VS CURATED LEAN BACK LISTENING
06
Music played on
FM/AM Radio| 48%
07
08
09
10
Recommendations
from friends | 26%
YouTube | 23%
Live performances
on TV | 19%
Music played on
internet radio | 19%
MUSIC I SELECT
MYSELF
Music videos
on TV | 14%
TOTAL
Music played in films/TV
Shows/Games | 13%
Live performances
on the radio |9%
Live performances
at gigs/festivals | 9%
Music videos linked
from YouTube | 7%
Younger generations were
more likely to discover new
music via online sources, with
15-19 year olds significantly
over indexing on discovery
through YouTube, music linked
through YouTube and Music
Played on Internet Radio.
23%
TOTAL
YOUTUBE
51
%
68%
20-24
68%
25-34
60%
35-49
59%
19%
MUSIC SELECTED BY A
COMPUTER PROGRAM / ALGORITHM
28%
59%
15-19
50+
TOP MEANS OF DISCOVERY BY AGE
MUSIC SELECTED BY
OTHERS (I.E. RADIO DJ'S)
11%
14%
20%
27%
55%
37%
Generally, the older the respondent, the more their
music is selected by someone else, i.e a Radio DJ.
In contrast, the younger the respondent, the more
music they select themselves.
INTERNET RADIO
15-19
36
%
MUSIC DISCOVERY: Question 7: How do you typically discover new
music? By ‘New music’ we mean both hearing about new music
from artists you already like, AND hearing about artists that are
totally new to you. The music doesn’t need to be brand new, just
‘new to you’.
Base: 3198 Respondents
CURATED LISTENING: Question Q6: How is your music listening
split between the following? (100% question)
Base: 3,198 Respondents (US nat. rep. sample)
13%
21%
18%
19%
14%
8%
13
12
AUDIOMONITOR // MAY 2015
MUSIC
DISCOVERY
�
FREEMIUM: IS IT CONVERTING
ENOUGH USERS INTO PAYING
SUBSCRIBERS?
PAID/PREMIUM SUBSCRIPTIONS TO MUSIC STREAMING SERVICES
TOTAL
15-19
20-24
13%
This begs to question whether the freemium
heavily on their free tier to ‘funnel’ users into paying
model is sufficient in converting free users into
subscribers – whilst these platforms generated
paying subscribers. It is evident that the majority
$295M for music labels in the US through ad-
of non-paying US consumers are satisfied with,
supported free tiers last year, nearly $800M was
and will continue using, free ad-supported tiers,
generated by paid subscriptions. This indicates
and in an attention, access driven economy, this is
that the proficiency of a platform at this conversion
cause for concern. As the uptake for subscription
process is not only fundamental to the health of the
and streaming services increases, consumers are
platform’s eco-system, but also to the wider digital
essentially transitioning their listening. Just as the
music industry as a whole, as it determines how
download was a transition from the CD, streaming is
much these services are able to pay rights holders
a transition from the download. If a casual consumer
and record labels and thus their artists.
is content with free streaming, logically, there should
However, in Audiomonitor, when users without a
be no reason for that user to additionally buy music.
paid subscription (2,654 respondents) were asked
As access models become more prominent, and
why they hadn’t paid to subscribe, at 59%, the top
digital sales are challenged, the US music market
reason was because they were ‘happy with using the
may start to experience turbulence, as the prospect
free version with ads’. This was considerably higher
of consumer transition potentially squeezes revenue
than ‘it’s too expensive’ at 39% and ‘it doesn’t appeal
margins even further.
4%
11%
83%
6%
17%
83%
3%
26%
25-34
On-demand streaming services, like Spotify, rely
to me’ at 23%.
15
14
AUDIOMONITOR // MAY 2015
MUSIC
SPENDING
35-49
15%
50+
6% 4%
80%
4%
70%
5%
80%
Base: 3,198
Respondents (US
nat. rep. sample)
90%
PAID
SUBSCRIPTION
FREE SUBSCRIPTION
(FREE TRIAL ETC)
NONE
59
%
of respondents stated
they did NOT have a
paid subscription to
a music service
because they were
happy using the free
version with ads
25-34
YEAR OLDS
significantly over-indexed
on paid subscriptions to
music streaming services
46
%
of respondents
stated they did
hing
not spend anyt
d
on music relate
products
�
17
16
AUDIOMONITOR // MAY 2015
DEVICES
SCREEN-AGERS OPT FOR
INTERACTIVE DEVICES
As a rule of thumb, the older the respondents, the
This all fits neatly into the more general trend
less active they were in mobile audio consumption.
away from traditional ‘broadcaster to audience’
Significantly, in the ‘screen-agers’ (15-19 years) age
media and towards a more social and interactive
group, the mobile phone has now overtaken the
media environment. Younger audio consumers have
standalone Radio Receiver as the most listened to
opted for devices with screens and internet access,
device.
which allows them to curate and share their own
With better portability, ease of use and the
audio experience.
‘always-on’ connection to mass catalogues of
music, mobile devices offer greater simplicity
AUDIO CONSUMPTION DEVICES BY SHARE OF EAR
FM/AM
RADIO RECEIVER
17.2%
12.9%
CELLPHONE OR
SMARTPHONE
12.7%
LAPTOP OR
NETBOOK
than traditional devices in joining up discovery
to consumption. Additionally, 15-19 year olds do
9.9%
9.8%
DESKTOP
COMPUTER
not share their mobile devices with their parents
or siblings - it is theirs, and that makes it a very
INTERNET/WIFI
CONNECTED RADIO
personal object. If music is a reflection of identity,
then these devices become a powerful trigger for
6.4%
3.5%
consuming music.
TELEVISION
BRAND OF CELLPHONE/SMARTPHONE USED TO LISTEN TO AUDIO
TABLET
OR E-READER
HD RADIO
RECEIVER
43
%
Q4g. You said that
you have used
a cellphone or
smartphone to
listen to audio.
Please specify its
model.
Base: All using
a cellphone or
smartphone to
listen to audio 688 Respondents
iPhone
29%
Samsung
4.3%
3.5%
3.2%
6.3%
5.4%
5.4%
10 additional devices covered
10
%
LG
in the full report:
4%
Motorola
audiencenet.co.uk/audiomonitor
Question Q4b: In which
of the following ways
did you yesterday listen
to – summary
Base: 2,692
respondents (all those
who listened to any
audio yesterday)
23.2%
26.6%
17.5%
TOTAL
15-19
�
 Historical archive . public document