SS xy
1.
r
2.
A1 A
SS xx SS yy
SS xy
SS xx
SS xx
SS xx
b1
SS yy
SS xx SS yy
0 1 0
1 d b a b
1 ad bc
I
ad bc 0 1
ad bc c a c d ad bc 0
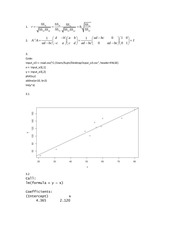
3.
Code:
input_e3 <- read.csv("C:/Users/liujm/Desktop/input_e3.csv", header=FALSE)
x <- input_e3[,1]
y <- input_e3[,2]
plot(x,y)
abline(a=10, b=2)
lm(y~x)
3.1
3.2
Call:
lm(formula = y ~ x)
Coefficients:
(Intercept)
4.365
x
2.120
�
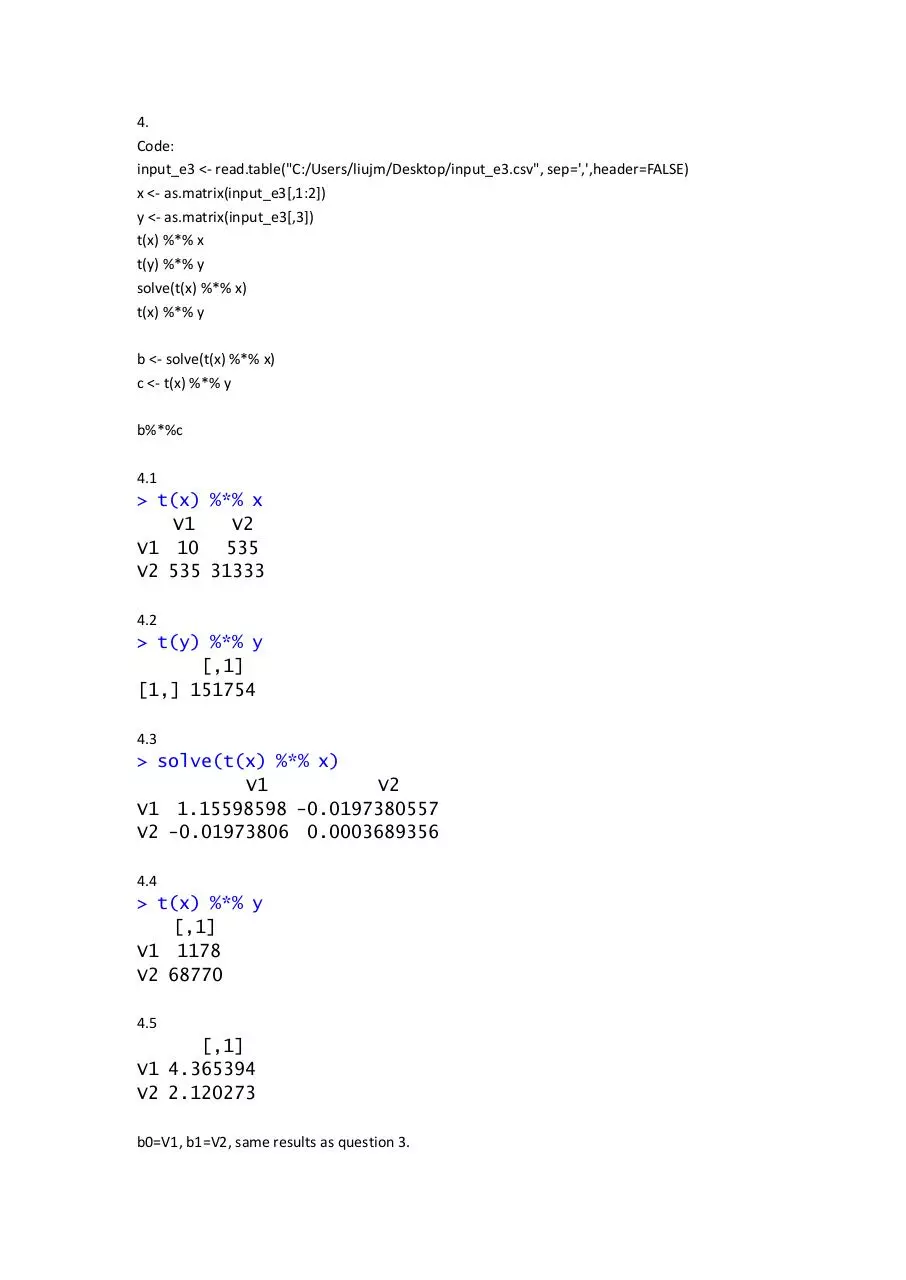
4.
Code:
input_e3 <- read.table("C:/Users/liujm/Desktop/input_e3.csv", sep=',',header=FALSE)
x <- as.matrix(input_e3[,1:2])
y <- as.matrix(input_e3[,3])
t(x) %*% x
t(y) %*% y
solve(t(x) %*% x)
t(x) %*% y
b <- solve(t(x) %*% x)
c <- t(x) %*% y
b%*%c
4.1
> t(x) %*% x
V1
V2
V1 10 535
V2 535 31333
4.2
> t(y) %*% y
[,1]
[1,] 151754
4.3
> solve(t(x) %*% x)
V1
V2
V1 1.15598598 -0.0197380557
V2 -0.01973806 0.0003689356
4.4
> t(x) %*% y
[,1]
V1 1178
V2 68770
4.5
[,1]
V1 4.365394
V2 2.120273
b0=V1, b1=V2, same results as question 3.
�
 Historical archive . public document