THE BULL
�
Highlights
• No technical analysis!
• No adjustments!
• Excellent trade for IRA accounts
• 73% win percentage
• +21.6% annual return (2002 – July 2013 YTD)
• +26.5% annual return, excluding 2008
• +3.5% S&P 500 annual return 2002 – 2013 YTD
(SPX: 1148 on 1/2/02 to 1606 on 6/28/13)
• +8.7% Russell 2000 annual return 2002 – 2013 YTD
(RUT: 489 on 1/2/02 to 977 on 6/28/13)
�
Guidelines
• Entry: 65 DTE / Underlying is Russell 2000 Index (RUT)
• Exit: 37 or 30 DTE; when back month is at 65 DTE, or position is
down -$250 per lot
• Max Loss: -$250
• Approximate Planned Capital: $2,750 per lot ($3,000 - $250
credit received)
• Sell 30 point bull put vertical. Short strike is strike closest to 10
Delta (i.e. 870) and long strike is 30 points lower (i.e. 840).
• If $250 max loss is reached (i.e. in January) before back month
(i.e. February) is at 65 DTE, go to sidelines and wait until 65 DTE
to enter back month.
�
Example Position
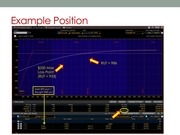
RUT = 986
$250 Max
Loss Point
(RUT = 933)
Sold 870 put /
Bought 840 put
�
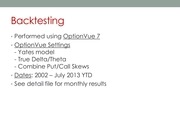
Backtesting
• Performed using OptionVue 7
• OptionVue Settings
- Yates model
- True Delta/Theta
- Combine Put/Call Skews
• Dates: 2002 – July 2013 YTD
• See detail file for monthly results
�
ANNUAL REVIEW
�
2002
• 7 wins / 5 losses
• -16.3%
• RUT: -21.7% (489 to 383)
• Avg. Volatility: 25.4%(OV) / 27(VIX)
• Only losing year other than 2008
• Note: Shaded areas on price graphs denote losing months
�
2002
�
2003
• 10 wins / 2 losses
• +33.9%
• RUT: +45.4% (383 to 557)
• Avg. Volatility: 21.6%(OV) / 22(VIX)
�
 Historical archive . public document