HUMAN
POWER
T E C H N I C A L J O U R N A L O F T H E I H P VA
NUMBER 52 SUMMER 2001
Summaries of articles in this issue; mast . . . . . . . . . . . . . . . . . 2
Contributions to Human Power . . . . . . . . . . . . . . . . . . . . . . . . 2
Articles
The mechanical efficiency of bicycle derailleur and
hub-gear transmissions
Chester Kyle and Frank Berto . . . . . . . . . . . . . . . . . . . . . . . . 3
Technical notes
Bicycle stability after front-tire deflation
Dave Wilson . . . . . . . . . . . . . . . . . . . . . . . . . . . . . . . . . . . . . . .
There is a better way than rolling
Detlev Tschentscher. . . . . . . . . . . . . . . . . . . . . . . . . . . . . . . . .
Tire-rim compatability, John Stegmann . . . . . . . . . . . . . . . . .
Control of hydrofoils using dynamic water pressure
Alastair Taig . . . . . . . . . . . . . . . . . . . . . . . . . . . . . . . . . . . . . .
11
12
13
14
Project review
CHicK-2000 Project Team “Active Gals”
Reviewed by Mark Drela . . . . . . . . . . . . . . . . . . . . . . . . . . . . 16
Book review
Richard’s 21st Century Bicycle book(s), by Richard
Ballantine, reviewed by Dave Wilson . . . . . . . . . . . . . . . . . . 19
Letters
Battle Mountain crank arms, Matt Weaver . . . . . . . . . . . . . . .
Response to Matt Weaver, Danny Too. . . . . . . . . . . . . . . . . . .
Crank-arm length and leg length/proportions?
John Stegmann . . . . . . . . . . . . . . . . . . . . . . . . . . . . . . . . . . . .
Response to John Stegmann, Danny Too . . . . . . . . . . . . .
Number 52
Summer 2001
Editorials
$5.50
19
20
21
21
A bit of history viewed from Eastern Europe
Marek Utkin . . . . . . . . . . . . . . . . . . . . . . . . . . . . . . . . . . . . . . . 23
The future of Human Power, Dave Wilson . . . . . . . . . . . . . . . 23
�
HUMAN POWER
is the technical journal of the
International Human Powered Vehicle
Association
Number 52 Summer 2001
Editor
David Gordon Wilson
21 Winthrop Street
Winchester, MA 01890-2851 USA
<dgwilson@mediaone.net>
Associate editors
Toshio Kataoka, Japan
1-7-2-818 Hiranomiya-Machi
Hirano-ku, Osaka-shi, Japan 547-0046
<HQI04553@nifty.ne.jp>
Theodor Schmidt, Europe
Ortbühlweg 44
CH-3612 Steffisburg, Switzerland
<tschmidt@mus.ch>
Jean Anderson
P.O. Box 12858
San Luis Obispo, CA 93406-2858
<jean.anderson@ihpva.org>
Philip Thiel, Watercraft
4720 - 7th Avenue, NE
Seattle, WA 98105 USA
Production
JS Design & JW Stephens
IHPVA
Paul MacCready, Honorary president
Ben Wichers Schreuer, Chair
Open, Vice-chair
Open, Secretary/treasurer
Publisher
IHPVA
PO Box 1307
San Luis Obispo, CA 93406-1307 USA
Phone: +805-545-9003
E-mail: <hp@ihpva.org>
Human Power (ISSN 0898-6908) is
published irregularly for the International
Human Powered Vehicle Association,
a non-profit organization dedicated to
promoting improvement, innovation and
creativity in the use of human power
generally, and especially in the design
and development of human-powered
vehicles.
Material in Human Power is copyrighted
by the IHPVA. Unless copyrighted also
by the author(s), complete articles
or representative excerpts may be
published elsewhere if full credit is
given prominently to the author(s) and
the IHPVA. Individual subscriptions and
individual issues are available to nonIHPVA and non-HPVA members.
2
Summer 2001
IN
THIS ISSUE
The mechanical efficiency of bicycle
derailleur and hub-gear transmissions
Chet Kyle and Frank Berto have given us
a long-awaited and very valuable report
on a precise study of the efficiencies of a
wide range of bicycle transmissions. It is
both quantitative and well discussed. One
intriguing conclusion is that, in general,
hub gears have efficiencies about a couple
of points lower than do derailleurs.
However, hub gears that were “run in”
and lubricated with light oil rather than
grease showed efficiencies almost up to
the derailleur level. As the authors state,
one arrives at more (interesting) questions.
TECHNICAL
NOTES
There is a better way than rolling
Detlev Tschentscher is following the
pioneering work of John Dick, who
made “Springwalker”, in studying and
building human-powered “exoskeletons”
that promise to make walking faster and
possibly capable of surmounting higher
obstacles and rougher ground.
Further experiments on run-flat stability
after front-tire deflation
Dave Wilson reports further experiments
that seem to confirm (though on the basis
of only two tests) that a good tight fit of
tire to rim is also vital to provide run-flat
stability and control.
Tire-rim compatability
John Stegmann relates, humorously at
times, his adventures in manufacturing
rims and in coping with the tendency of
tires to creep and to allow the tubes to pop
out and explode. He found that a good tight
fit is important.
Control of hydrofoils using dynamic
water pressure
Most (all?) HP hydrofoils have had
their angle of attack controlled through
a surface skimmer attached to a linkage.
CONTRIBUTIONS
TO
$5.50/IHPVA members, $4.50
Al Taig has developed a lower-drag and
cleaner alternative: using the impact (pitot)
pressure picked up on the leading edge of
the strut supporting the foil from the hull
and controlling the attack angle from, e.g.,
a bellows.
PROJECT
REVIEW
CHicK-2000 project team “Active Gals”
Mark Drela reviews the report and
videotape of a remarkable Japanese team
that has achieved record performances
with a talented woman pilot and an
innovative plane. The wing uses a stressedskin construction, allowing the main spar
to be an I-beam and producing a “. . . wingtip deflection [that is] amazingly small
considering its low empty weight of 31 kg
and its immense wing aspect ratio of 44.”
BOOK
REVIEW
Richard’s 21st century bicycle book(s),
by Richard Ballantine.
Your editor reviews two versions of
the same book by Richard Ballantine:
one in British English for the UK-European
market, and one in American English for
the North Americans. He gives two thumbs
up.
Chester R. Kyle, Ph.D.
Frank Berto
INTRODUCTION
Since human power provides the
propulsion for a bicycle, losses in
mechanical energy are far more important than if purely mechanical or electrical power is used.
The mechanical efficiency of a drive
system is defined as the ratio of the
power output to the power input in percent. Typically, automotive drive systems are from 80% to 99% efficient [1],
meaning that from 1% to 20% of the
energy input is lost in friction. A welloiled straight chain-and-sprocket bicycle drive can be as high as 99% efficient
[2]. With other types of bicycle transmissions, however, the range in efficiency can be similar to an automobile,
that is from 80% to 99% [5–11]. In a
bicycle, small losses can mean large
performance differences—especially in
competition [3, 4].
For example, suppose Christopher
Boardman, the present holder of the
bicycle world hour record (56.375 km;
Manchester, England, 1996), were to
use a bicycle with a drive that lost 2%
more energy than his record machine.
Boardman would travel almost 0.5 km
less in one hour [3]. The hour record
has been broken several times in the
past 30 years by less than 0.5 km. If an
Olympic 4000-meter pursuit team were
to use bicycles that were 2% less efficient, they would be about 2 seconds
slower in the 4000-meter team-pursuit
race, which would have moved them
from first place to fourth place in the
1996 Atlanta Olympics (4 min 8 sec vs.
4 min 6 sec) [4]. By using the wrong
fixed gearing, differences of 2% are easily possible.
Previous published reports
There have been many published
reports on the mechanical efficiency of
bicycle transmissions during the past
century; however, only a few have
measured the efficiency using accurate
mechanical means [1, 2, 5, 6, 7, 8, 9,
10, 11]. These studies found that bicycle drive efficiency depends upon many
conditions such as load, chain tension,
rpm, gear sizes, and the transmission
type. As mentioned, the efficiencies
varied from about 80% to 99%. The factors causing energy loss will be discussed in more detail later.
Mechanical methods of testing normally employ dynamometers that measure torque and rotational speed at the
input and output of the drive system
(with mechanical or electronic transducers). The combined energy losses in
Photo, courtesy of Chet Kyle
Number 52
HUMAN POWER
The mechanical efficiency of
bicycle derailleur and hub-gear transmissions
LETTERS
Comments by Matt Weaver and John
Stegmann on a paper in Human Power 51
on crank-arm length on recumbents, and
responses by author Danny Too.
EDITORIALS
Marek Utkin writes a guest editorial
from Poland on aspects of the HPV scene
there.
Your editor reviews some discussions on
the future of HUMAN POWER.
HUMAN POWER
The editor and associate editors (you may choose with whom to correspond) welcome
contributions to Human Power. They should be of long-term technical interest. News
and similar items should go to HPV News or to your local equivalent. Contributions
should be understandable by any English-speaker in any part of the world: units should
be in S.I. (with local units optional), and the use of local expressions such as “two-byfours” should either be avoided or explained. Ask the editor for the contributor’s guide
(available in paper, e-mail and PDF formats). Many contributions are sent out for review
by specialists. Alas! We cannot pay for contributions. Contributions include papers,
articles, technical notes, reviews and letters. We welcome all types of contributions
from IHPVA members and from nonmembers.
Number 52 Summer 2001
Human Power
Bicycle crank
dynamometer,
furnished by
the USOC
Sports
Sciences
Division
Human Power
Number 52 Summer 2001
3
�
all drive-train components such as
the bearings, chains, sprockets, gears,
and derailleurs are usually included in
the efficiencies. However, some studies
report the efficiency only of isolated
components [6, 7, 9]. Thom [6] measured the efficiency of three-speed hub
gears and bearings without including
sprocket losses. Dell’Oro [7] isolated
derailleur losses from the rest of the
drive system. Cameron [9] measured
the required static force to lift a known
weight with a bicycle chain draped
over a single sprocket. He assumed
losses were constant with rpm, and
estimated fixed-gear efficiencies under
various loads. The remaining studies
measured the overall efficiency of the
bicycle drive system [1, 2, 5, 8, 10, 11].
Indirect methods such as repetitive
field time trials, field or laboratory oxygen-consumption studies, crank-powermeter field trials, or crank-power-meter
studies on stationary trainers, lack the
necessary precision to give reliable
results. Usually such methods have an
error band of several percent.
today in Europe where they are used
mainly on city commuter bikes. Hubgear transmissions have the advantage
of being nearly weatherproof, with low
maintenance—and they permit a chain
guard that completely shields the chain,
and allow bicycle commuting without
worrying about soiling good clothes on
a greasy chain. However, they have
never been popular with serious recreational cyclists or racers since the
range of gears has been limited. Also,
they are heavier than a derailleur-type
transmission and they have had the
reputation of being mechanically inefficient. Recently, however, there has
been a revival of interest in the hub
gear for several reasons. They are now
available with an increasing number of
gears (as many as 14), they lend themselves to fully automatic operation, and
they can easily be adapted to bikes
with an electric-motor boost. Regarding
the hub gear’s reputation for mechanically inefficiency, this paper will present information that shows this is not
necessarily so.
electronically. The output shaft of the
motor was connected to a bicycle
crank through a flexible coupling.
Knowing the torque and the rpm, the
input power to the crank could be
calculated. The dynamometer was furnished by the U.S. Olympic Committee
(USOC) Sports Sciences Division.
The power input to the bicycle crank
was given by:
Pi = kτω where Pi is the power, k
is a proportionality constant, τ is the
torque and ω is the angular velocity of
the crank.
NEW
Purpose of current tests
To measure power output, a Monarch aluminum ergometer wheel was
driven by a chain from the drive-train
fixture through two 36-tooth sprockets,
one on the ergometer wheel, and one
on the non-drive side of the bicycle
hub. A nylon cord, approximately 3 mm
in diameter, was wrapped twice around
the ergometer wheel with one end
attached to a transducer and the other
hanging downward with a suspended
weight. The direction of rotation of
the wheel was away from the hanging
weight so the tension in the load-cell
cord (slack side) was a small fraction
of the applied hanging weight (load
side). The ergometer load and thus
the power output could be adjusted by
hanging various weights on the nylon
cord. Knowing the difference in tension
between the two cords and the rpm,
the output power from the bicycle
hub could be calculated. The rpm of
the ergometer wheel was measured
electronically.
The power output of the system was:
Po = kωo(Τ1−T2), where Po is the output power, k is a proportionality constant, ωo is the ergometer wheel angular velocity, T1 is the weight, and T2 is
the slack-side tension.
A disadvantage of this method was
that the friction losses in the ergometer
wheel drive were unknown. In order
to find the corrected transmission
TESTS
During 9–13 October 2000, in the
Laboratory of the Browning Research
Facility on Bainbridge Island, Washington, the authors and Peter Kauffman, technical consultant to Browning
Research, used a specially-devised
dynamometer system to measure the
mechanical efficiency of eleven bicycle
transmissions. The transmissions were
two Browning automatic bicycle transmissions (a 4-speed, and a 12-speed),
a Shimano 27-speed mountain-bike
derailleur transmission and eight internal hub-gear transmissions (Shimano
3-, 4- and 7-speed, Sachs 3- and 7-speed,
Sturmey Archer 3- and 7-speed, and a
Rohloff 14-speed.
Most of the previous bicycle-transmission tests were done on derailleurtype chain drives [1, 7, 8, 9] and these
efficiency tests were limited to only
a few gears. As far as the authors
know, the wide-ranging 27-speed transmissions available today have not been
tested, or at least the tests have not
been published. No doubt manufacturers have tested their transmissions for
efficiency, but if so, the results of their
tests are unpublished.
Prior to the 1970s, before derailleurequipped bikes became really popular,
there were some efficiency tests performed on planetary hub gears [5,
6]. Hub gears are still quite popular
4
The purpose of the current tests was
to compare the mechanical efficiency
of the most common types of bicycle
drives under identical conditions. Since
limited time was available, the test
apparatus had to handle all of the
most common types of bicycle transmissions and to rapidly measure efficiency. Since power input to a bicycle
crank is typically between 50 and 400
watts [4], and since losses can be as
low as one to two percent, the transmission test system had be sensitive
enough to determine power differences
of just a few watts (less than 5).
TEST
EQUIPMENT
The test system consisted of four main
elements (see photo on page 3).
1. Bicycle crank dynamometer
To measure input power, a dynamometer fed power to a bicycle crank
by means of a 2-horsepower variablespeed DC motor, mounted on gimbals
so that the motor case could rotate
freely. The motor case was restrained
by a torque arm attached to an electronic load cell that measured the
torque force. Oscillations in the load
were smoothed by connecting the
torque arm to the load cell through a
thin nylon cord that transmitted force
through a flywheel-type inertial damper. The rpm of the motor shaft was
measured by timing each revolution
Number 52 Summer 2001
2. Bicycle-drive-train fixture
A special test fixture was built to
mount a bicycle bottom bracket, crank
and chainrings, plus a rear hub without
spokes or wheel. On the non-drive side
of the hub, a sprocket was attached to
the hub which drove a Monarch bicycle
ergometer wheel. The adjustable fixture was built by Jim Merz for Browning Research, and it allowed rapid
changing of front sprockets, chains and
rear hubs.
3. Monarch ergometer wheel
Human Power
efficiency, the ergometer drive losses
would have to be determined, and this
was done only at 75 rpm. However,
for determining the rank order between
transmissions, since they were all tested under identical conditions, no correction is necessary. The efficiencies
reported in this article include ergometer-wheel drive losses, so the actual
transmission efficiencies would be
higher by 2 to 2.5%.
4. Data-acquisition system
A portable computer was adapted by
Peter Kauffman of Browning to receive
signals from the load cells and revolution counters. The computer sampled
the transducers and averaged the readings over a selected time interval.
The software automatically calculated
ergometer power along with the
mechanical efficiency of the bicycle
drive including the ergometer drive. All
of the data and calculations were displayed in tabular form on the computer
screen, and the data were stored for
later analysis.
TEST
PROCEDURE
• The load cells were calibrated
using weights. The load cells agreed
with the weights within ±0.2%. The
accuracy of the angular-velocity transducers of both the crank and the
ergometer wheels were checked by two
methods. The crank rpm was verified
with a stop watch. The rpms of both
the crank and the ergometer wheel, as
indicated by the transducers, were then
used to compute the gear ratio which
was compared with the known ratio.
The calculated gear ratio agreed with
the known ratio normally within three
significant figures (one part in 1000).
• The first test series was with the
crank dynamometer directly connected
to the ergometer wheel through two
36-tooth gears. The purpose was to
estimate the power losses of the ergometer wheel drive. Since chain tension
is probably the most important factor
in gear friction [8] the ergometer wheel
weights were the same as those used
in normal testing—from 1.8 kilos to 16
kilos. The speed of the crank and wheel
were constant at 75 rpm. This test did
not directly measure ergometer-wheel
drive losses since the wheel rpm did
not vary (as when testing transmissions). Also, the bottom-bracket bearings were in the loop, making an extra
set of bearings. The friction losses were
small (from 1 to 6 watts; see fig. 13*),
but as previously mentioned, accountHuman Power
ing for the losses would raise the
reported efficiencies by 2 to 2.5%.
• The test fixture was then used to
test the efficiency of eleven transmissions. Weights were chosen to produce
80 watts, 150 watts and 200 watts output power at 75 crank rpm. All chains
were well oiled with light machine oil.
Hub gears were usually left with their
original grease lubricant, but this was
replaced in two hubs with light oil.
The transmissions that were tested
had the following gears.
Derailleur-type transmissions
4-speed automatic: Browning
This transmission has a gear layout
similar to a standard derailleur system
except electronically actuated hinged
gear segments in the rear cluster shift
the chain up or down either automatically or manually. The Browning chain
guide and tensioner, with its two jockey pulleys, has a similar appearance to
a derailleur, and probably has nearly
identical friction characteristics. It is
however a passive follower. In this
paper, the two Browning transmissions
and the 27-speed derailleur transmission will often be referred to as “derailleur-type” transmissions. The Browning
4-speed was tested with a 42-tooth
front chainring and a 12-, 17-, 23-, and
32-tooth rear cluster.
12-speed automatic: Browning
An automatic transmission similar
to the Browning 4-speed, except with
three front chainrings 48/38/30, and the
same 4-speed rear cluster 12/17/23/32.
The gears are (1) 30/32; (2) 38/32;
(3) 30/23; (4) 48/32; (5) 38/23; (6) 30/17;
(7) 48/23; (8) 38/17), (9) 30/12);
(10) 48/17; (11) 38/12; and (12) 48/12.
27-speed: Shimano
A Shimano Ultegra 27-speed mountain-bike transmission with three front
chainrings (44/32/22 teeth) and a
9-speed rear cluster (12, 14, 16, 18,
20, 23, 26, 30, and 34 teeth). Because
of time constraints, only 15 of the
27 gears were tested: (1) 22/34;
(3) 22/26; (4) 32/34; (7) 22/20; (9) 32/26;
(10) 44/34; (11) 22/16; (15) 32/20;
(16) 44/26; (18) 22/12; (20) 32/16;
(21) 44/20; (24) 32/12; (25) 44/16; and
(27) 44/12.
Planetary-geared rear hubs
3-speed: Sachs
An internal planetary-geared rear
hub with a 40-tooth front chainring
*See pages 8–11 for figures and tables.
Number 52 Spring 2001
and a 19-tooth rear cog. The three hub
gears are: (1) Ratio = 0.75); (2) 1.00;
and (3) 1.33.
3-speed: Shimano
A rear hub with a 40-tooth front
chainring and a 19-tooth rear cog. The
three hub gears are: (1) 0.74; (2) 1.00;
and (3) 1.36.
3-speed: Sturmey Archer
A rear hub with a 40-tooth front
chainring and a 19-tooth rear cog. The
three hub gears are: (1) 0.75; (2) 1.00;
and (3) 1.33.
4-speed: Shimano Auto D
A rear hub with a 31-tooth front
chainring and a 23-tooth rear cog. The
four hub gears are: (1) 1.00); (2) 1.24;
(3) 1.5; and (4) 1.84.
7-speed: Sachs
A rear hub with a 40-tooth front
chainring and a 19-tooth rear cog. The
transmission shifter was damaged and
could be shifted to only two gears:
(1) 0.59 and (4) 1.00.
7-speed: Shimano Nexus
A rear hub with a 40-tooth front
chainring and a 19-tooth rear cog. The
seven hub gears are: (1) 0.63); (2) 0.74;
(3) 0.84; (4) 0.99; (5) 1.15; (6) 1.34; and
(7) 1.55.
7-speed: Sturmey Archer
A rear hub with a 40-tooth front
chainring and a 19-tooth rear cog. The
seven hub gears are: (1) 0.60; (2) 0.69;
(3) 0.80; (4) 1.00; (5) 1.24); (6) 1.45; and
(7) 1.68.
14-speed: Rohloff
A rear hub with a 40-tooth front
chainring and a 16-tooth rear cog.
The fourteen hub gears are: (1) 0.279;
(2) 0.316; (3) 0.360; (4) 0.409; (5) 0.464;
(6) 0.528; (7) 0.600; (8) 0.682; (9) 0.774;
(10) 0.881; (11) 1.000; (12) 1.135;
(13) 1.292; and (14) 1.467.
RESULTS
AND DISCUSSION
We tested each transmission at
three loads: 80 watts, 150 watts, and
200 watts (power output at the ergometer wheel)—all at 75 rpm. The crank
speed of 75 rpm was chosen as being
typical of recreational cyclists. There
was insufficient time available to test
each transmission at both variable load
and variable rpm. The power outputs
of 80, 150 and 200 watts, represent
the typical energy requirements of commuting or recreational cyclists in good
physical condition, traveling at speeds
from 24–35 kph (15–22 mph), on a
level, smooth road with no wind [1, 3].
Bicycle racers can produce steady
5
�
power outputs that are much higher
than this for periods of more than
one hour—from 300 to 450 watts [3].
Although the occasional recreational
cyclist may produce over 200 watts,
it is doubtful that cyclists using hub
gears would frequently put out more
than 150 watts unless being chased by
rabid dogs. The results of the tests are
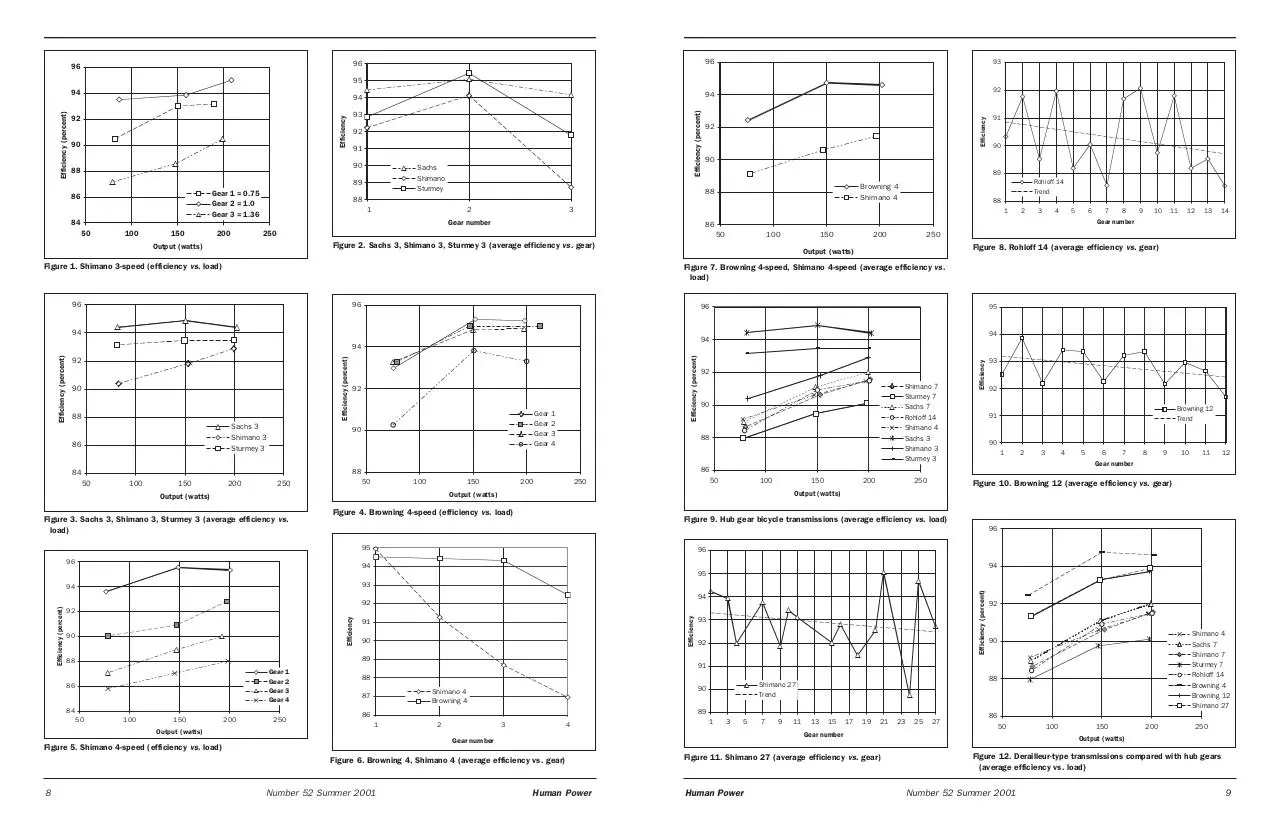
shown in figures 1–14.
PLOTTING
EFFICIENCY
In figures 1–12 the efficiency is plotted in three ways.
1. Efficiency vs. power output
Here all of the individual power
and efficiency data points were plotted
for each gear. These curves give the
detailed performance of each transmission under varying load. As examples,
see figures 1, 4 or 5. All transmissions
were not plotted but they could be,
using the data in tables 1 and 2.
2. Average efficiency vs. gear number
Here, efficiencies for all test loads
were averaged for each gear and the
averages were plotted against the gear
number. This curve shows the effect of
gear ratio on efficiency under varying
load conditions. For examples see figures 2, 6, 8, 10, or 11.
3. Average efficiency vs. load
Here, transmission efficiencies for
each load were averaged for all gears.
This curve is a measure of the performance of each transmission under
varying conditions. For example, see
figures 3, 7, 9, or 12. These curves provide probably the simplest way to compare transmissions.
CONCLUSIONS
By viewing the curves, several general
observations and conclusions can be
made.
1. Efficiency generally increases with
the load—for all transmissions.
Figures 1, 3, 4, 5, 7, 9, 12, or 14
all show this trend. Although friction
increases with chain load, rpm, and
other factors [8], obviously the residual
friction in a gear train becomes less
important as the input power increases,
while the friction factors that increase
with load go up less rapidly than the
load.
The clearest example of this is
shown in figure 14. This was the only
case where we tested a transmission
at over 200 watts and under 80 watts.
More tests were planned, but a shear
pin parted in the drive train and this
experiment was aborted. The uncor6
rected efficiency increased from about
91% to over 97% as the output power
increased from 50 watts to 370 watts at
75 rpm.
By assuming that ergometer-wheel
rpm has no effect on the drive losses
(fig. 13), a rough estimate of the absolute system efficiency can be made.
Spicer shows that drive-train losses
are a function of the crank rpm [8];
however, as previously explained, this
effect was not measured. When corrected for ergometer-drive losses, the transmission efficiency increases from 1% to
3% (see fig. 14). Efficiency is over 98%
at the highest load. The corrected efficiencies are in good agreement with
Spicer [8] who found that efficiency
was over 98% with 52/15-tooth sprockets at 200 watts.
2. Hub gears are generally about 2%
lower in efficiency than derailleur-type
gears. But there are exceptions.
This is illustrated by figures 3, 6, 7,
and 12. Figure 12 shows that the efficiencies of the Shimano 4, Sachs 7,
Shimano 7, Sturmey 7 and the Rohloff
14 all cluster about two percent lower
than the Browning 4, Browning 12, or
the Shimano 27.
However, two of the 3-speed hub
gears did not follow this trend.
The grease in the Sachs 3 and the
Sturmey Archer 3-speeds was replaced
with light oil, and unlike the other hub
gear transmissions, the efficiencies of
the Sachs 3 and Sturmey 3, compare
well with the best of the derailleur
transmissions (figs. 7, 9, and 12).
Also, these transmissions were worn
in, whereas many of the others were
new. Manufacturers would do well to
replace heavy grease in their hub gears
with light oil. Although oil wouldn’t
last as long as grease, the energy
savings would be significant. Unfortunately commuters have a tendency
to ignore maintenance until something
breaks, so light oil probably wouldn’t
be a popular choice.
Also, with the Shimano 4, the first
gear (a 1.0 ratio) had a higher efficiency than the derailleur transmissions,
even though gears 2, 3, and 4 had a
lower efficiency (see fig. 6). In a planetary transmission (also called epicyclic), even when the hub ratio is 1.0,
the planet gears are still in motion [12];
however, all of the planetary transmissions we tested had high efficiency at
1.0 gear ratios.
3. As the gear ratio increases, the
Number 52 Summer 2001
efficiency tends to decrease for all
transmission types.
This is illustrated by the trend lines
in figures 6, 8, 10, and 11. Even though
the greatest efficiencies are sometimes
near the highest gear ratios, the average efficiency decreases with higher
ratios, (the high efficiencies were:
Shimano 4 = gear 1, Rohloff = gear 9,
Browning = gear 2, and Shimano 27 =
gear 21).
4. With modern transmissions, where
multiple gears are available, there is
often a difference of 1% to 3% in efficiency between adjacent gears.
This applies to both hub gears and to
derailleur gears. See figs. 2, 6, 8, 10, and
11 (especially figures 8, 10 and 11).
In figure 11, in the Shimano 27-speed,
there is a 4% difference in efficiency
between gears 21 and 24 and between
gears 24 and 25. In figure 8, for the
Rohloff 14, there is a 3% difference
between gears 7 and 8.
An average 2% difference in efficiency is thus easily possible if the wrong
gears are chosen.
If racers, or even commuting or touring cyclists, could choose optimum
gears they would be hundreds of
meters ahead at the end of 60 km
(37 mi). For example, if Lance Armstrong, in the Tour de France 58.5-km
time trial (36.4 mi) were to choose
the wrong gear, a drop of 2% in efficiency would cause him to be 410 meters
behind (27 seconds) at the end of the
time trial, easily enough to lose the
stage [3]. Incidentally, Armstrong averaged about 54 kph (33.6 mph) for the
time trial (58.5 km long = 36.4 mi).
With commuting riders who travel
24 kph (15 mph), instead of 54 kph
(33.6 mph), it only gets worse. A 2%
drop in efficiency would lead to an
800-meter gap (about 2 minutes). The
reason for the increasing gap is that the
slower cyclist spends much more time
on the course [3]. The point is, why
waste energy when it is unnecessary.
5. The tests show that some gears
are inefficient.
Hub gears
In hub gears, such as the Rohloff
14, the efficiency no doubt depends on
how many elements of the gear train
are in motion as each gear is selected
(see fig. 15). In the Rohloff, gears 3, 5,
7, 12, and 14 have the lowest efficiency.
This superb but complex transmission
has roller bearings and uses light oil as
a lubricant. Shifting is quite simple: sucHuman Power
cessive gears are reached by pulling on
the single shift cable in one direction
or the other. No attempt will be made
to explain this mechanism. It is obvious
from the diagrammatic illustration (fig.
15) that it cannot easily be explained.
Derailleur gears
On the other hand, factors affecting
the efficiency of derailleur gears
become clear by examining the curves
in figures 10 and 11. For example, a
12-tooth sprocket seems to cause inefficiency. In the Shimano 27-speed, gears
4, 9, 15, 18, and 24 have the lowest
efficiency. The two gears with the lowest efficiency of the 15 tested, both
use a 12-tooth sprocket. The gears with
12-tooth sprockets (18, 24 and 27) have
an average efficiency of 91.2%, while
those involving 16-tooth sprockets (11,
20 and 25) have an average efficiency
of 93.5%.
Other gears
In the Browning, the 12-tooth sprockets averaged 92.1% efficiency, while
the gears involving a 17-tooth sprocket
averaged 92.9%. The two lowest efficiencies of the 12 gears tested had
12-tooth sprockets (gears 9 and 12).
Apparently the sharp angle of chain
link bend in the 12 causes increased
friction compared to larger sprockets.
So it appears that larger gears than 12
are necessary for efficient operation.
When there is a choice of gear ratios
that are close, cyclists should choose
the gearing combination with larger
diameters [8].
Cross-chain gears make little difference. In the Shimano 27, the cross
chain between the two big gears on the
Shimano has a higher-than-average efficiency (gear 10, 44/34), while the cross
chain between the two small sprockets
involves a 12-tooth sprocket (gear 18,
22/12; see fig. 11). In the Browning,
the large cross-chain gears (gear 4,
48/32), have a higher-than-average efficiency, while the small-gear cross
chain involves a 12-tooth sprocket (see
fig. 10).
For some reason that is not apparent, the mid-chainrings on both the
Browning 12 and the Shimano 27 did
not have high efficiencies. On the
Browning 12, gears using the 30-tooth
chainring (1, 3, 6, and 9) had a lowerthan-average efficiency. On the Shimano 27, gears using the 32-tooth chainring (4, 9, 15, 20 and 24), all had a lower-than-average efficiency. This does
not appear to be a coincidence, but the
Human Power
reason is not clear.
Had more time been available, it
would have been interesting to measure the effect of such things as rpm,
all gears in the 27-speed, a wider range
of power inputs, and various chain and
hub-gear lubricants. As usual, there are
more questions than answers.
CREDITS
The authors wish to thank Browning
Research for making available the facilities of their laboratory for this project
and for supporting this study.
Thanks also to the Sports Sciences
Division of the United States Olympic
Committee for loaning us the bicyclecrank dynamometer.
REFERENCES
1. Kyle, C.R. and V.J. Caiozzo. 1986
(May). Experiments in human
ergometry as applied to the design of
human-powered vehicles. Int. Jl.
Sport Biomech. 2:6–19.
2. Marks, L.P. 1979. Mark’s standard
handbook for mechanical engineers,
8th ed. NY: McGraw Hill. p3–29, 11–7.
3. Bassett, D.R., C.R. Kyle, L. Passfield,
J.P. Broker and E.R. Burke. 1999.
Comparing the world hour record in
cycling, 1967–1996: Modeling with
empirical data. Medicine and Science
in Sports and Exercise, 31:11,
1665–1676.
4. Broker, J.P., C.R. Kyle, and E.R.
Burke. 1999. Racing cyclist power
requirements in the 4000-m individual
and team pursuits. Medicine and
Science in Sports and Exercise,
31:11, 1677–1685.
5. Whitt, F.R. and D.G. Wilson. 1982.
Bicycling science. Cambridge: MIT
Press. Figure 11.16, p. 296.
6. Thom, A.P., G. Lund and J.D. Todd.
1956 (July 1). Efficiency of threespeed bicycle gears. Engineering,
180:78–79.
7. Dell’Oro and M. Malone. 1995. Bicycle
derailleur losses. Melbourne:
University of Melbourne, Department
of Mechanical and Manufacturing
Engineering.
8. Spicer, J.B., M.J. Ehrlich, J.R.
Bernstein and C.J.K. Richardson
(Johns Hopkins University); M.
Masahiko Fukuda and M. Terada
(Shimano Inc.) 1999 (June) .
Efficiency and energy-loss location in
bicycle chain drives. Journal of
Mechanical Design.
9. Cameron, A. Measuring drive-train
efficiency. 1998–99. Human Power,
Number 52 Summer 2001
46:5–7.
10. Wilson, D.G. Transmission efficiencies. 1999. Human Power, 48:20.
11. Kyle, C.R. 1998 (September 15).
The mechanical efficiency of bicycle
transmissions. Report to Browning
Research.
12. Berto, F., R. Shepherd and R. Henry.
2000. The dancing chain. San
Francisco: Van der Plas Publications,
pp 23, 48–52.
THE
AUTHORS
Chester Kyle, adjunct professor of
mechanical engineering at California
State University at Long Beach, is a
consultant on the science of sports
equipment and has worked with several
teams and organizations: US Postal Service 2001 Tour de France team, design
teams for USA 1984 and 1996 Olympics
cycling teams’ bicycles and clothing,
and Nike, as well as others, for aerodynamic sports clothing.
Co-organizer of the first International
Human Powered Speed Championships
at Irwindale, California, in 1975, Kyle
and eleven others founded the International Human Powered Vehicle Association (IHPVA) the following year. Kyle
is past president and secretary of the
IHPVA, as well as the de facto historian
of the organization. Editor and publisher of Cycling Science (1989–1991) and
science editor of Bicycling Magazine
(1984–1989), Kyle is a frequent contributor to scientific and popular publications.
Chet Kyle and his wife, Joyce, live on
ten acres of rural pasture and forest in
a home they and their four, now-grown
children built near Weed, California.
Frank Berto, author of more than 150
articles and several books on cycling
technology, was engineering and West
Coast editor of Bicycling Magazine
(1986–1990). Berto is a consultant
on oil field gauging and instrumentation, cycling equipment and technology
(especially gearing), as well as a frequent expert witness on cycling litigation. He is also a historic aircraft and
machinery enthusiast.
Frank and Connie Berto live in San
Anselmo, California, on a large plot of
land affectionately called “Sleepy Hollow”.
Berto’s latest book, The Dancing
Chain, was reviewed in Human Power
51, Fall 2000.
7
�
96
96
96
93
95
92
91
90
88
Sachs
Shimano
Sturmey
89
Gear 1 = 0.75
Gear 2 = 1.0
Gear 3 = 1.36
84
50
100
150
200
2
50
150
200
3
4
5
6
7
8
9
10
11
12
13
14
250
Figure 8. Rohloff 14 (average efficiency vs. gear)
96
90
88
Sachs 3
Shimano 3
Sturmey 3
92
Gear 1
Gear 2
Gear 3
Gear 4
90
92
Shimano 7
Sturmey 7
Sachs 7
Rohloff 14
Shimano 4
Sachs 3
Shimano 3
Sturmey 3
90
100
150
200
50
250
100
150
Output (watts)
Figure 4. Browning 4-speed (efficiency vs. load)
92
Browning 12
Trend
91
90
1
2
3
4
250
5
6
7
8
9
10
11
12
Gear number
Figure 10. Browning 12 (average efficiency vs. gear)
Figure 9. Hub gear bicycle transmissions (average efficiency vs. load)
95
96
200
Output (watts)
Output (watts)
Figure 3. Sachs 3, Shimano 3, Sturmey 3 (average efficiency vs.
load)
93
86
50
250
94
88
88
200
95
94
Efficiency (percent)
Efficiency (percent)
96
96
94
94
95
93
94
94
Efficiency
90
Efficiency
92
92
91
90
89
88
Gear
Gear
Gear
Gear
86
1
2
3
4
84
50
100
150
Output (watts)
200
250
Efficiency (percent)
Efficiency (percent)
92
84
Efficiency (percent)
2
Figure 7. Browning 4-speed, Shimano 4-speed (average efficiency vs.
load)
94
93
92
92
Shimano 4
Sachs 7
Shimano 7
Sturmey 7
Rohloff 14
Browning 4
Browning 12
Shimano 27
90
91
88
87
88
Shimano 27
Trend
90
Shimano 4
Browning 4
89
86
1
2
3
4
1
3
Figure 6. Browning 4, Shimano 4 (average efficiency vs. gear)
Number 52 Summer 2001
5
7
9
11
13
15
17
19
21
Gear number
Gear number
Figure 5. Shimano 4-speed (efficiency vs. load)
8
100
Output (watts)
94
150
88
Gear number
Figure 2. Sachs 3, Shimano 3, Sturmey 3 (average efficiency vs. gear)
96
100
Rohloff 14
Trend
86
250
96
50
Browning 4
Shimano 4
1
Figure 1. Shimano 3-speed (efficiency vs. load)
86
90
89
3
Gear number
Output (watts)
91
90
88
88
1
92
Efficiency
86
Efficiency
90
93
Efficiency (percent)
92
92
94
94
Efficiency
Efficiency (percent}
94
Human Power
Figure 11. Shimano 27 (average efficiency vs. gear)
Human Power
23
25
27
86
50
100
150
200
250
Output (watts)
Figure 12. Derailleur-type transmissions compared with hub gears
(average efficiency vs. load)
Number 52 Summer 2001
9
�
R2 = 9.97064E-01
8
98
Efficiency (percent)
Power loss (watts)
6
5
4
3
95
2
3
4
93.0
95.3
95.3
93.3
95.0
95.0
93.3
94.8
94.9
90.3
93.8
93.3
Browning 12
Automatic
80
150
200
91.1
93.8
92.7
92.5
93.9
95.2
91.3
92.5
92.8
91.6
94.5
94.2
92.5
93.3
94.3
91.2
92.9
92.7
Shimano 27
Ultegra Mtn. Grupo
80
150
200
93.1
94.6
95.0
—
—
—
92.8
94.6
94.5
89.4
92.9
93.6
—
—
—
—
—
—
18
—
90.7
91.8
91.9
—
—
20
—
90.9
93.0
93.8
—
—
21
—
94.3
95.0
95.9
—
—
24
—
86.9
91.0
91.4
—
—
25
90.6
93.8
94.8
95.5
97.1
97.2
27
54
80
150
200
307
370
94
Uncorrected Eff.
Corrected Eff.
Uncorr. Eff.
Corrected Eff.
93
Shimano 27
(continued)
91
1
1
96
92
2
Gear =
Power
80
150
200
Maker/Speeds
Browning 4
Automatic
97
7
0
Table 2. Derailleur-type transmisions: mechanical efficiency vs. load
99
y = -3.60886E-12x3 + 8.73374E-08x2 - 1.98405E-04x + 1.88475E+00
90
0
2000
4000
6000
8000
10000
12000
14000
16000
50
18000
100
150
200
250
300
350
400
Output (watts)
Net ergometer load (grams)
Figure 13. Power loss vs. net ergometer load
5
6
7
Efficiency Percent
8
9
10
11
12
91.9
93.8
94.0
90.7
93.5
94.4
90.9
92.2
93.4
91.1
93.7
94.1
89.8
93.4
93.2
89.8
91.8
93.5
92.6
94.5
94.2
—
—
—
90.0
92.5
93.1
92.1
93.9
94.2
91.7
93.8
93.9
—
—
—
Figure 14. Shimano 27-speed, gear 25 (44/16) uncorrected and
corrected (efficiency vs. load; 75 crank rpm; correction is
estimated)
1
2
3
95.0
94.2
94.1
92.9
95.6
94.9
93.6
94.8
94.1
4
5
6
7
8
Efficiency Percent**
Shimano 3
80
150
200
90.5
93.0
93.2
93.5
93.9
95.0
87.2
88.6
87.2
Sturmey 3
80
150
200
92.3
93.3
93.0
95.4
95.3
95.6
91.8
91.8
91.8
Shimano 4
Automatic
80
150
200
93.6
95.6
95.3
90.1
90.9
92.8
87.1
88.9
90.0
85.8
87.0
88.0
Sachs 7
80
150
200*
88.7 —
89.9 —
91.0* —
—
—
—
89.2
92.3
93.0*
Shimano 7
80
150
200
90.8
91.8
92.8
90.7
92.9
94.5
87.4
89.9
90.3
89.0
89.0
91.8
83.6
85.6
86.4
90.9
92.8
93.7
88.2
90.4
91.4
Sturmey 7
80
150
200
87.3
89.1
89.7
88.7
89.0
90.3
88.4
91.1
91.3
93.0
93.3
94.7
89.3
90.4
91.0
86.0
88.5
88.6
83.0
85.4
85.3
Rohloff 14
80
150
200
89.1
90.6
91.3
90.3
92.5
92.5
87.8
89.9
90.9
90.3
92.2
93.4
87.5
89.6
90.5
87.8
91.0
90.9
86.1
89.9
90.2
9
10
11
12
13
14
Figure 15. Diagrammatic view of the Rohloff hub
TECHNICAL
Bicycle stability after
front-tire deflation
Dave Wilson (reporting partly for
Soohyun Park)
89.7
92.6
92.8
90.8
92.7
92.7
87.7
90.4
91.1
89.7
92.3
93.5
87.1
90.4
90.0
87.8
89.7
91.1
86.1
89.1
90.4
*The shift mechanism was broken, and would shift to only two gears.
** All efficiencies are uncorrected for the power consumed by the ergometer wheel drive. Although this is not large,
it would increase the indicated efficiencies by 2 to 2.5% in most cases.
10
NOTES
Number 52 Summer 2001
Human Power
We reported in Human Power, 51
(pp. 16–18) on experiments to provide
steering stability after a front tire
has deflated, there having been many
reports of “flopping” instability that
caused riders to be thrown off virtually
instantaneously. We reported the tentative findings of Andy Oury, who
increased the bead-seat diameter of
so-called “drop-center” rims1 and thereby greatly decreased the tendency of
Human Power
89.5
93.0
93.6
16
91.0
93.6
93.9
91.1
93.3
93.7
Table 1. Hub gear transmisions: mechanical efficiency vs. load
Gear =
Maker/Speeds Power
Sachs 3
80
150
200
15
deflated tires to “flop” from side to side.
This past academic year another MIT
undergraduate student, Soohyun Park,
chose to do her BSME thesis2 on a
continuation of this study. She first
researched an improved bicycle model,
resulting in the use of a BMX bicycle
with a weight mounted on it representing approximately a rider’s weight and
center of mass. She found that over a
wide range of weight values and positions the tire behavior when this bicycle was pushed across the laboratory
floor was better represented than in the
previous program.
Park then built up the bead-seats of a
wheel that had caused me serious trouble when the tire had deflated as I
was in front of a very large truck. She
Number 52 Summer 2001
used fiberglass tape and polyester resin
(Oury had used layers of masking
tape, which gave a soft seat of low
strength). She found, as did Oury, a
steady improvement in behavior as
the bead-seat diameter was increased.
Subsequently I continued the build-up
(the fit between the tire and rim was
exceedingly loose) until the diameter
was too large for the tire, and then
machined it down (using a profiled
router) until a smoothly shaped rounded-edge bead seat was produced that
allowed the tire bead to snap into position only after the tube was inflated to
about half final pressure.
When this final step was taken the
difference in performance changed dramatically. Flopping disappeared entirely, and the tire could provide safe
and stable bicycle direction during the
deceleration after deflation.
These results therefore add to the
previous somewhat tentative recommendation: that wheel and tire manufacturers and standards organizations
should arrive at standards for the sizes
and profiles of rims and of tire beads so
that a fit tight enough to produce stable
steering under deflated conditions is
achieved. There seems little doubt that
many deaths and injuries would thereby
be prevented.
—Dave Wilson
<dgwilson@mediaone.net>
1. Cycle and motorcycle tires and wheel-rim
standards. ETRTO, supplied by the Taiwan
Bicycle Industry R&D Center, Taichung,
Taiwan, 2001.
2. Park, Soohyun (2001). Run-flat performance of bicycle tires and modified rims.
BSME thesis, Cambridge, MA: MIT.
11
�
There is a better way
than rolling
by Detlev Tschentscher
Human-powered vehicles on land
usually have wheels. But there are
attractive alternatives.
WALKING
AND RUNNING AIDS
Humans are just ordinary mammals
except for two differences:
• we walk on two legs; and
• we consider ourselves to be intelligent.
This should mean that we have the
ability to improve our lives. It is surprising therefore that we do not use this
intelligence to improve our natural way
of movement: walking on two legs.
John Dick (one of the designers of the
Springwalker, member of the DARPA*
team) describes the situation as follows:
“We have had 150 years of engineering
now, and still there is no powered exoskeleton.”
When we refer to human-powered
vehicles on land, we usually mean
wheeled vehicles. And, as we all know,
there has been enormous progress as
these types of bicycles and other HPVs
have evolved. They seem to be given
attention only when breaking a record.
Nearly every college in the U.S. has a
project group devoted to human-powered vehicles. The technology and
parts to build an advanced bicycle
are available for reasonable prices all
over the world. But what makes us
believe that rolling is the only way
of moving such that it is worth so
much attention? Of course, if we had
to choose between walking or riding
a bike for traveling a distance of a
few kilometers on a gravel road we
would definitely choose the bike. The
reason for this is obvious: riding a
bike takes less effort than walking.
But what does this prove? Simply
that a mechanically supported method of movement is easier than a nonsupported movement.
To be able to compare walking to
rolling, as in the situation described
above, we should establish equal
opportunities between the two methods. Both the cyclist and the runner
should be mechanically supported.
But what does a device for the support of human running look like? To
give an answer we first need to ana*US Defense Advanced Research Projects Agency, Department of Defense
12
lyze where and how the human way of
running needs to be supported. One of
the main weak points in human running
is, that (because of our leg design) we
use only little energy for the forward
movement. If we would divide a normal
step into separate actions, only the part
where we jump up to move forward is
useful in gaining ground. The rest of
the movement is wasted for our fight
against gravity.1 Another approach for
support is to focus on increasing the
distance covered with just one step.
Research in bionics shows that kangaroos for example can run long distances at very high speed with very low
energy consumption. They can jump up
to a length of six meters and store the
energy that would normally be wasted
by a kind of spring-mechanism, using
their tail as a kind of spring. Several
approaches have been made to make
this simple phenomenon available for
humans.
In the early 1920s a number of patents came up which basically used the
idea of a pogo-stick attached to the
lower leg. But these patents did not
result in much improvement to running.
Until 1990 nothing really significant
occurred. Then a group of people
around the technician John Dick built a
prototype of an improved exoskeleton
which he called the “Springwalker”. The
device was a huge step towards a
Figure 1. One of the illustrations from the
Springwalker U.S. patent document
Number 52 Summer 2001
usable walking device. It combined the
use of artificial legs with a spring pack
on the back of the runner (see fig. 1).
Although the Springwalker was reported in all news media it was never
improved to become a functioning
device for the market. Today inventors
focus on servo-powered versions of the
Springwalker for military use. But a
few other attempts have gone into production. Several kangaroo-boots have
appeared on the market recently.2
Most of these are aimed at fitness
enthusiasts and are based on several
spring-systems attached to ski-boot-like
boots. With these boots it is possible
to jump up to four meters at two
meters high. Two technicians, Atanow
and Gordejew, of the Lufthansa-university of Ufa, even created a boot powered by a fuel engine. With this device
it is possible to take a one-hour walk
using only a matchbox full of petrol
(gasoline). But these efforts cover only
a small section of the latest research on
walking machines.
Most of the current research is in
robotics. To create a servo-powered
device that is able to walk requires
sophisticated development combining
biomechanics with information technology. This challenge has stimulated most
advanced research institutes and companies to work on walking robots in
some form or another. The number of
projects is immense. Even big overviews such as the “walking machine catalog” of the German institute of the FZI
Research Center for Information Technologies at the University of Karlsruhe3
are not able to show the full range of
historic and current projects. Most of
the projects are focused on multi-legged
vehicles or humanoid-legged robots.
The key issue of these projects is to
control the complex process of moving
servo-powered legs without losing the
balance. But all these devices have one
thing in common: they rely on artificial
power sources.
Only very few studies follow the
former Springwalker in using human
power as the only power source. One
of them is the network-initiative Kenguru4 that I started. We plan to build
an empowered running device such as
the Springwalker, except that a different kind of technology will be used: the
power of the runner’s arms. First contacts to industrial and other organizations have been made. All actual information about all current projects and
the Kenguru initiative can be viewed on
Human Power
the internet on my homepage (see reference 4).
REFERENCES
1. Homepage of the DARPA: http://
www.darpa.mil/dso/thrust/md/
exoskeletons/index.html
2. A good example of “kangaroo” boots
are made by Powerskip. See
http://www.powerskip.com
3. Link to walking machine catalog:
http://www.fzi.de/ids/WMC/
walking_machines_katalog/
walking_machines_katalog.html
4. Homepage: http://www.kenguru.de
Detlev Tschentscher is a production
engineer who has been working on
designs for human-powered legged
vehicles for four years.
—Detlev Tschentscher
Neusser Landstrasse 352
Germany 50769 Cologne
Tel: +49 (0) 221-978622
Fax: +49 (0) 40 360 306 4005
E-mail: <Detlev@springwalker.de>
money?” (Bike Tech 2:5), I talked to
a South African aluminium producer/
extruder and decided that their 6063
aluminium alloy would be soft enough
to roll easily, would be strong enough
after heat treatment, and would then be
suitable for anodizing if required.
Chris Juden’s article, “The aluminium
rim: Design and function,” (Bike Tech
3:2), was the great inspiration. It provided a wealth of information on rims,
tires and wheels. I chose to make a rim
with an inside width of 16 mm which
would suit tires from the then-popular
22-mm high-pressure tires to the more
practical 38 mm. My new IZIZI profile
should result in a mass of 280 gms/
meter and suit the stock 4-mm aluminium rod that would be used to pin the
joint. I based it on the successful Rigida
1622 which is similar to the Moulton.
(IZIZI was the name I chose because
it reads the same when viewed from
either side of the wheel.)
Tire-rim compatability
John Stegmann
Dave Wilson’s thoughts on the subject of front-tire blowouts (Human
Power 51, Fall 2000) reminded me of
the difficulties we encountered making
rims a decade ago. When I commented
to Dave that we had not considered
that tire manufacturers too might have
difficulty in maintaining size standards,
or that the wheel size might diminish
during wheel building, he asked to
reproduce the account which I wrote
for Cycling Science, with adjustments
if desired (Cycling Science, June 1990).
I had been inspired in 1987, by articles
that had appeared some years previously in Rodale’s technical journal, Bike
Tech, to make my own bicycle rims in
order to overcome two difficulties. One
was the high cost of imported aluminium-alloy rims, and the other was the
difficulty in purchasing rims of unusual
sizes and drillings that were needed for
the recumbents we were making. Suppose I could make the rims I wanted
and cover the cost by making and
selling popular rims? I discussed the
idea with friend and factory-owner Bill
Rosenberg, and came to an arrangement whereby he would assist me to
make the tools and would manufacture
the rims in his factory, and I would
provide the capital, the design, and
marketing.
After reading Mario Emiliani’s, “Heat
treated rims: Are they worth the
Human Power
Illustration from Cycling Science, June 1990
By the end of January 1988 we had
sample extrusions from the new die.
We made two rollers—stage 1 and
stage 2—and we marked out the hole
centers by hand. It all looked good
and we placed our first order for
50kg. The first rims we made were for
my new experimental FWD recumbent
with crank axle attached to the front
fork, based on information and encouragement from Californian Tom Traylor.
The bicycle was designed for 25-520
7.9-bar (115 psi) wired-on tires and was
to be ridden in the Argus Tour on 5th
March 1988. All it needed was wheels.
There was no time for heat treatment
as the bike was completed six days
before the event and I still had to
Number 52 Summer 2001
learn to ride it! To our surprise, the
rims proved to be quite satisfactory
and were never heat treated. Although
heat treating after rolling is definitely
the preferred procedure, a certain
amount of hardening does take place
during rolling, as well as during use and
with age.
The next rim was made to suit a popular 25-622 fold-up high-pressure tire.
We had it heat treated and anodized
in dark bronze, and built a beautiful
wheel with stainless-steel spokes and
a red powder-coated hub. I had made
an appointment in the morning with my
bank manager to apply for a loan to
start manufacture. I pumped the tire to
6.9 bar (100 psi) and set it aside. We
were excited at the success and by the
prospects. Little did we know that our
problems were about to begin.
I was still busy in my workshop five
hours later when the tube exploded!
Why? Was the tire defective? Had the
tire or tube been badly fitted? Was the
rim under size? I checked as much as I
could, yet found no obvious reason for
the failure. I therefore fitted a new tube
using talcum power to ensure that the
tire moved onto the rim properly, and
took the beautiful wheel with me to
the bedroom to show my wife in the
morning. Two hours later, at 3 A.M., we
almost died from shock when we were
woken by a very loud bang! Another
tube had burst!
At that time Karl Wright, an electronic-engineering student, was boarding with us. He was an excellent student (graduated top of a class of
over 800) but was equally puzzled.
Together we measured and calculated,
and destroyed several tubes under reasonably controlled conditions. We saw
how, slowly, the tire would bulge and
the tube creep out from below and
then rapidly balloon. If we were quick
enough we could deflate the tube
before it burst. We made a series of
rims, ever larger, until we could no
longer mount the tire. It took more
than a month to develop a theory to
explain the phenomenon, and another
six weeks to prove it. This is what we
established.
1. We had assumed that because the
flanges are almost 6 mm high, a variation of, say, 2 mm in bead-seat circumference would have an insignificant
effect since this would make a difference of only 0.63 mm in the diameter
of 622 mm. Wrong! The smallest difference in circumference can be disas13
�
trous. Tie a string around a beer
can and you will easily slip a matchstick between them. Similarly, if the
bead-seat circumference was 1952 mm
instead of 1954 mm, there would be sufficient slack for the tire to blow off the
rim. This also is the reason why rims
work fine with quite a shallow well.
2. Given that the air pressure is
equal, the stress in the casing of a narrow tire will be less than that of a fat
tire since the force is a function of the
cross-sectional diameter. Therefore, if
there is a little slack in the rim/tire fit,
at some point around the wheel the tire
will lift a little. That lifting increases
the cross-sectional diameter and consequently also raises the stress in the
tire fabric slightly more than elsewhere.
This increased tension slowly draws to
that region whatever other slack there
might be. This may take time, but can
be speeded up by dusting the tire/rim
interface with talcum.
3. The 25-520 tires for the first
wheels had wire beads. The 25-622 foldup tires that blew off used synthetic
beads. We had only one other 622 tire.
It had steel beads and worked fine.
We found that the tires with synthetic
beads could be mounted on a larger rim
than the wire-beaded tire. However,
we reasoned that that was not where
our problem lay. Our problem had to
do with the fact that synthetic beads
squash. Our rim had a bead-seat ledge
that was too narrow for the flattened
synthetic bead, so the tire tended to
slide off into the well. This action
reduces the cross-sectional diameter
which allows the tire to be pulled
around, usually to the opposite side of
the wheel, where a bulge would form
and the failure occur.
REMEDY
and mountain bikes arrived. IZIZI rims
were fitted to the recumbents used by
Lloyd Wright for two of his winning
rides in the 105 km Argus Cycle Tour,
and to Wimpie van der Merwe’s recumbent when he set the course record
(which still stands) and three IHPVA
world records, one of which still
stands. Despite these achievements and
the fact that we exported rims (Kingcycle), local dealers avoided us saying
that buyers wanted a big-name rim. The
expected (hoped-for!) swing to recumbents never happened. None of these
factors was good for business. We did
not make enough money to afford to
re-tool to make aero or mountain-bike
rims. In retrospect, that is probably
what we ought to have done to save
the business.
—John Stegmann
<recumbent@cybertrade.
...
 Historical archive . public document