The BondBeat
Friday, July 07, 2017
See GP disclaimer HERE
In The News …
RTRS: Bank of Japan offers to buy unlimited amount of bonds to calm markets
BBG: Yen Drops to 8-Week Low as BOJ Acts to Limit Increase in Yields
ZH: Panicked BOJ Unleashes Bond Buying Bazooka: Offers To Buy Unlimited 10Y JGBs At 0.11%
BBG: U.K. Factories, Builders Cut Output, Clouding Growth Outlook
BBG: BOE Policy Hawks Face New Signs of Weakening U.K. Economy
BBG: German Industry Output Rises for Fifth Month Amid Solid Upswing
BBG: Bond Rout Sounds Warning for Equities
RTRS: China FX reserves edge up by $3 bln in June to $3.057 trillion
BBGs @boes_ Fed’s Fischer Says Fiscal-Policy Uncertainty Denting Investment
BBG: GUNDLACH Sees More Pain for Bond Bulls as Hedge Funds Make Exit
BBG: Dalio Calls End of Central Bank Era, Time to Head to Party Exit
Quick (& clickable) Links:
What Happened Overnight
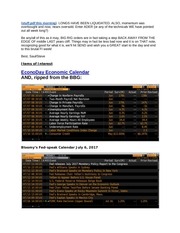
Bloomy/EconODay Calendar
Fri 7/7/2017 5:10 AM
- Econ Indicators
- 5yr & Under
- Index Spreads
USTs are leaning gently (now) into the RED after a lower opening/grind
in Tokyo. JGBs having gone from 5bps end of June up to just over 10bps
yest, are LEADING … on heels of BoJs open-ended commitment to BUY
UNLIMITED AMT to counter recent runup in yields. TGIF! Say that a few
times. THINK about it – click/READ several h’lines below as I’m NOT just
making this up … Build it and they will come? This mornings version of
central banking that frankly, doesn’t seem to be getting nearly enough
attention. Yields UP and central banks have weighed in. “BOJ Offers to
Buy Unlimited Amount in Fixed-Rate Bond Operation” –BBG
th
Otherwise, some MIXED data so far – German Indus Prod UP (5 mo in
a row) while UKs notsomuch. Pick which YOU’d like to build whatever
narrative. ALSO worth knowing – Fischer last night on UNCERTAINTY
denting investment? Yep. See Matt Boesler story below. And finally,
while we respect ALL of the bears – check out CNBC story below that
st
details WHY Nomura’s Goncalves got bearish 1 time in 10yrs. NOTE
that story ends with NOT BEARISH QUOTE FROM NONE OTHER
THAN DAVID ADER. "…My time horizon for this is a matter of 24 hours.
Maybe it goes on a little bit longer than that. This is not going to be the
theme of the summer, that we are now going to have a bearish bond
Items Of Interest
GP Documents:
-
Daily Pivots (end of TECHs)
POSITIONS UPDATES
Specs covered SOME 10y, Eurodollar
shorts BUT GOT SHORTER’er on dur wtd
basis
StreetStuffWkly 07.03.17
StreetStuff 07.07.17
Technicals 07.07.17
�
move in the summer. The seasonals are favorable to us. The economic data in the U.S. has been benign
and the Fed is hawkish," he said. "What I think has changed is near-term sentiment and near-term
positioning," he added. "I think the market generally, which is at odds with the Fed outlook, will turn out to
be correct." NFP straight ahead. Whether or not positions have adj to where they NEED to be and the
SPEC LONGS have been flushed (seems to be THE driving force of Gundlach’s bearishness), I do not
know. Perhaps this afternoons close and CFTC data will shine some light. For NOW, though, have a
great start to the day and end to this rough week!
What’s On OUR Minds
Well. You made it. NFP Friday. You may have gotten banged up a bit this week (and last)… we
are all somewhat more proficient in technical analysis now -- everything broke what seems to be
every important technical level. Bonds. Stocks. gold/copper ratios … FI bears are having
another moment. Gundlach. Dalio. We’re not naive in asking, though, if the concept of CBs
stepping back is wishful thinking OR if this really IS the beginning of the end? And if so, what is
ending? (McClellan, “Treasury - Bund Spread Gives Early Warning of the End … If we ever
see a time when the yield on German bonds is higher than that of U.S. 10-year T-Notes, making
a dip below zero in these charts, that will mark a great buying opportunity for the stock market, if
the past 30 years’ experience is any guide. And a few months from now, we should see a major
price top for the stock market, which the current divergence is just now starting to foretell.”)
For somewhat MORE -- and an UPDATED 10s/BUNDS visual -- feel free to point and click this
mornings once again VERY BEARISH TECHNICALS.pdf.
Willing and able to admit that we’d be long and wrong basing this sort of idea/concept/process
of thought ON funDERmental data (ADP > ISM nMfg h’line, for example), we are as anxious as
the next guys for this mornings NFP.
Whether or not it will turn out to MATTER is another topic entirely. Perhaps one better left for
whatever we HOPE to cobble together and send over the weekend.
So, for NOW, rather than end on a ‘high note’ (in other words, lean on something supportive of
OUR bias - as we did YESTERDAY with latest from KESSLER), how about we quit while we’re
behind and leave you with a visual and background of something that may BE ‘good news’ and
so, supportive OF the current bearish opinion that is popular at the moment.
First the visual:
�
AND why we care … and by WE, well, have a look at recent WSJ story for current / updated
input (“Orders for new heavy-duty trucks are picking up again as fleet owners and
equipment manufacturers resume their recovery from last year’s slumping freight market.”)
AND for some bigger picture context, BBGs View column by David Ader back in Sept of 2016:
September 28, 2016, 10:15 AM EDT
As Heavy-Truck Sales Go, So Goes the Economy
August was a terrible month for selling big trucks. History says that's scary.
By David Ader
...“August’s Cass Freight Index continued to signal that overall shipment volumes (and
pricing) are persistently weak, with increased levels of volatility as all levels of the supply
chain continue to try and word down inventory levels,” Cass said in its latest report.
Weak truck sales have sometimes given false signals about a recession over the last 30odd years. But the sheer size of this August’s drop looks different. We’ve never seen a
plunge this steep that didn’t foretell a recession.
That was THEN and while we SHOULD be ending on this somewhat more positive economic
tone, cannot help but offer the latest quote/snippet from David Ader -- who was part of this
recent and VERY bearish FI story over on cnbc.com
The party is over: Central banks pull
the plug on bond market rally
•
•
•
Global bond yields have been rising as the world's central banks look set to move away from
extremely easy policies.
The Fed is leading the way higher, with another rate hike expected this year and a plan to
reduce its balance sheet, possibly starting in September.
Nomura strategists had been "devout bulls" for 10 years, and recently turned bearish
on the U.S. Treasury market.
...Not all analysts are convinced the bond market is sending an important signal. David
Ader, chief macro strategist at Informa Financial Intelligence sees the move as
temporary and largely technical.
"My time horizon for this is a matter of 24 hours. Maybe it goes on a little bit longer than
that. This is not going to be the theme of the summer, that we are now going to have a
bearish bond move in the summer. The seasonals are favorable to us. The economic
data in the U.S. has been benign and the Fed is hawkish," he said.
"What I think has changed is near-term sentiment and near-term positioning," he added.
"I think the market generally, which is at odds with the Fed outlook, will turn out to be
correct."
Once again, if you ONLY read the H’LINE you’d be misled into thinking EVERYONE ‘out there’
is bearish. While we GET the popular kids have not YET ‘dropped the mic’ -- seems to US that
guys like GUNDLACH, selling his current bearishness based on spec LONGS still being
liquidated, well, misses a couple points. FIRST, see CITIGROUPs LATEST RPM note
�
(stuff.pdf this morning). LONGS HAVE BEEN LIQUIDATED. ALSO, momentum was
overbought and now, nears oversold. Enter ADER (or any of the technicals WE have pointed
out all week long?)
Be any/all of this as it may, BIG RIG orders are in fact taking a step BACK AWAY FROM THE
EDGE OF middle LAST years cliff. Things may in fact be less bad now and it is on THAT note,
recognizing good for what it is, we’ll hit SEND and wish you a GREAT start to the day and end
to this brutal FI week!
Best, Saul/Steve
Items of Interest
EconoDay Economic Calendar
AND, ripped from the BBG:
Bloomy’s Fed-speak Calendar July 6, 2017
�
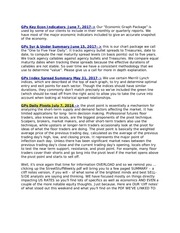
GPs Key Econ Indicators June 7, 2017-> Our “Economic Graph Package” is
used by some of our clients to include in their monthly or quarterly reports. We
have most of the major economic indicators included to give an accurate snapshot
of the economy.
GPs 5yr & Under Summary June 15, 2017- > this is our chart package we call
the “One to Five Year Daily”. It tracks agency bullet spreads to Treasuries, date to
date, to compute the real maturity spread levels (in basis points) out to five years.
We track agency callables against agency bullets and Treasuries. We compare equal
maturity dates when tracking these spreads because the effective durations of
callables are not stable. So over time we have a consistent methodology that we
use to determine “value”. Please give us a call for more in depth explanation.
GPs Index Spread Summary May 31, 2017-> We use certain Merrill Lynch
indices, which are described at the top of each graph, to try and determine optimal
entry and exit points for each sector. Though the indices should have similar
durations, they commonly don’t match precisely so we’ve included the green line
(which should be read off from the right axis) to allow you to take the curve into
account when looking at historical spread relationships.
GPs Daily Pivots July 7, 2016 -> the pivot point is essentially a mechanism for
analyzing the short-term supply and demand factors affecting the market. It has
limited applications for long- term decision making. Professional futures floor
traders, also known as locals, are the biggest proponents of the pivot technique.
Scalpers, brokers, market makers, and other short-term traders also use the
technique, while upstairs or longer-term traders occasionally look at the pivot for
ideas of what the floor traders are doing. The pivot point is basically the weighted
average price of the previous trading day, calculated as the average of the previous
trading day’s high, low, and closing prices. It represents the major point of
inflection each day. Unless there has been significant market news between the
previous trading day’s close and the current trading day’s opening, locals often try
to test the near term support, resistance, and pivot point. For example, many floor
traders cover their shorts and go long into the pivot level if the market opens above
the pivot point and starts to sell off.
Well, it’s once again that time for information OVERLOAD and so we remind you …
clicking up the StreetStuffWeekly.pdf will bring you to a few paged SUMMARY – a
cliff notes version, if you will – of what some of the brightest minds and best SELLSIDE analysts are saying and thinking. WE have focused mostly on things directly
impacting US RATES so you’ll find lots of specifics as well as economics AND EVEN a
couple of the more notable equity thoughts. Just because. Here are OUR ‘cliff notes’
of what stood out this weekend and what you’ll find on the PDF WE’VE LINKED TO:
�
StreetStuffWEEKLY July 3, 2017
More than a handful of GDP downgrades after Personal INCOME / SPENDING. Outright
levels still matter and there remains a wide variety of OPTIMISM out there. Steven Stanley,
case in point, “…This small shortfall was sufficient to shave two tenths off of my tracking
estimate for Q2 real consumer expenditures, from +3.2% to 3.0%, which in turn takes my Q2
real GDP projection down by two tenths from +3.6% to +3.4%...”
A few OTHER things caught my eyes and MAY be of interest:
CSFBs latest, "US Economy Notes: Core Inflation: Assessing Recent Weakness ... However, in
our view it is a mistake to view the recent weakness as just a short-term technicality, and the
FOMC’s forecast of a rapid return to 2.0% appears aggressive. Instead, we expect inflation in
one year to be closer to its 20 year-average of 1.7% ..."
GSs weekly EconOrama explores the downside risks of inflation? "...Taking into account last
week’s weaker inflation data, as well as downside risks in the shelter, healthcare, and
communications categories, we are lowering our year-end 2017 core PCE forecast to +1.6% (vs.
+1.7% previously). While we continue to expect a return to the Fed’s 2% inflation target by mid2019, further methodological changes in coming years could delay this...."
TD, “Tantrum in Progress? … Markets were caught off guard this week as central bankers hinted at
an earlier removal of global policy accommodation. While the move higher in yields may slow, we
continue to like being short duration and positioning for additional Fed rate hikes. The
market’s focus during the holiday-shortened week will fall on payrolls and the June FOMC minutes.”
DBs GLOBAL FI Weekly? “Coordinated tightening … The next leg of the repricing in rates will
need to be led by the US. This will require either a turn in core inflation or more tangible signs
of fiscal easing. Relative to current market pricing and positioning, risks remain asymmetric
towards an upside surprise in both cases…”
DBs H2 UST outlook, “Our forecast for 10y Treasury yields calls for 2.45% at the end of Q3
and 2.75% at the end of Q4. Compared to current market forwards 1, we are moderately
bearish. Our view is predicated on the term premium rising once the Fed begins to unwind
its balance sheet, and firmer global growth in the second half will help inflation and inflation
expectations recover”
AND MORE…
StreetStuff July 7, 2017
Today’s one of my favorite days of the month. the sell-side here gets to completely GUESS a number
(when using a random number generator might produce closest to the pin NFP guess-timate) and does
so with little consequence (when wrong, or right). It’s heads they win, tails we lose so away from ALL of
the experts … pros … guessing what NFP will print today. If I WERE gonna read a NFP preview, have a
look at Steve Stanley / Amherst. “…as the data currently stand, the last time that the headline payrolls fell
short of the 150k mark two months in a row was 2012. Thus, there is good reason to expect a
bounceback in June after May’s disappointing result…” >> Monty Python – the WITCH scene comes to
mind. I know, it’s just ME, right?? (reminder – YESTERDAY from Citi “Payrolls & Yellen: Don’t be
fooled by wages” followed BY, “NFP preview: Wages are the focus”.
In ANY case, there are a couple/few OTHER things that caught OUR eyes – first on POSITIONS (since it
seems to be large part of Gundlach BEAR story). Citi’s RPM Daily? “Building Short Base. In US, the
tactical long base has been entirely washed out (in both cash and futures) with positioning now mildly
short. Yesterday an additional $3mln was added to the short base (through long liquidation and new
�
shorts). Meanwhile similar long liquidation dynamics are occurring in the Eurodollar strip and in EM $
credit…”
ALSO WORTH NOTING:
Citigroup’s EUROPEAN RATES team – BUY BUNDS
Citigroup’s OD REMINDER, “One final little tidbit is that a year ago 10yr yields hit their historic lows
(1.318%) on July 6th—so Happy first Birthday to the bear market?”
GSs latest global STRAT paper, “Trade Fade - the risk to equities from slower world trade, “…One
potential risk to our central case is that global growth slows, or profits are hit, by increased US tariffs on
trade and the possibility of an escalating global trade war. While this is not our expectation, this topic has
once again become a focus for markets and could take centre-stage at the forthcoming G20 meeting…”
Technicals July 7, 2017
w/PIVS: 5s vs 1.94; 10s vs 2.36; 30s vs 2.89
Daily Pivots are RESISTANCE
What you’ll find and WHY you’ll wanna point/click:
GP: 10s/Bunds CONTINUES to work and is EASIEST way to be LONG US10s – watch 178bps (Nov
2015 peak) next
BBG: Bund Futures Volumes Surge to Year High as Yields Jump: Chart
BBG: German Bonds Face Fresh Downside Risks After Technical Breakout
CSFB: bearish, seller of strength 10s AND GOT SHORT 30s. “30yr US yields have broken with ease
price and 38.2% retracement support at 2.87/89%, and we stay bearish for 2.95%. Short. Add at 15316/26, stop above 154-00. Take profit at 151-20/16. Re-sell below, for 150-12. Above 154-00 should
see a recovery back to 154-12, potentially 155-02/09.”
GS on 10s, “U.S. 10-year yields Daily – The move since the Jun. 14th low is now looking
distinctly impulsive. The market is also through the 100-dma at 2.327%, a level which held the
previous interim high in May. This is still an incomplete iii of v waves which means that pullbacks
should be shallow/corrective. Would use a move to 2.32% and even 2.28% as an opportunity
to re-establish topside exposure. The next level above is the May 11th high at 2.42%. Overall,
expecting this to be a larger 1st of 5-waves, similar to the basing process that developed in July of
last year. In short, although there’s still a need for a corrective 2nd wave, it’s important to keep in
mind that a meaningful low is now likely in place. View: Add to topside exposure between
2.32% and 2.285%. Next level above is 2.42%. Eventually see potential to take out the 2.63%
highs from earlier this year.”
MMO for July 3, 2017
The Fed on Friday released daily market share data for fed funds, Eurodollars and RRP
activity for the first quarter. While there were no major surprises in the data, the
additional details provide useful color about the structure of the overnight market.
�
In The Press NOW:
July 7, 2017 4:59 a.m. ET
Bank of Japan Punches Down Bond Yields
As the global bond selloff intensifies, so does the central bank’s
intervention
Updated July 7, 2017 6:50 a.m. ET
Global Markets Fall on Worries About Central Bank Tightening
Global stock markets were lower ahead of the U.S. jobs report as investors weighed the prospect of
tighter policies by central banks around the world.
Updated July 6, 2017 9:34 p.m. ET
Fed’s Fischer Says Government Can Help Boost Productivity
Federal Reserve Vice Chairman Stanley Fischer said government actions, if done correctly, can do a lot to
reinvigorate moribund levels of productivity.
Updated July 6, 2017 5:16 p.m. ET
Global Bonds Sell Off, Deepening Losses
Investors around the world sold government bonds anew, as anxiety
deepened that central banks are moving toward reducing support from
monetary policy.
Updated July 6, 2017 1:00 p.m. ET
U.S. Oil Producers Find a Surprise New Market: China
China, one of the world’s largest oil importers, is buying nearly 100,000 barrels of oil a day from the
U.S., on average, the result of a surprise American glut that has made the country’s oil cheaper than
Mideast rivals.
Updated July 6, 2017 10:02 a.m. ET
U.S. Trade Deficit Narrowed in May
The U.S. trade deficit narrowed in May as exports rose to their highest level in more than two years. The
foreign-trade gap in goods and services narrowed 2.3% from the prior month to a seasonally adjusted
$46.51 billion in May, the Commerce Department said Thursday.
�
July 6, 2017 2:56 p.m. ET
Orders for Heavy-Duty Trucks Rise in June
Expansion signals renewed confidence in trucking industry that
had started 2017 by ramping up orders
July 6, 2017 6:52 a.m. ET
UP AND DOWN WALL STREET
Is the Fed Driven by Data Or Metaphors?
As inflation lags its target, Yellen & Co. seemingly revert to watching the
proverbial punchbowl.
Microsoft to Cut Up to 4,000 Sales and
Marketing Jobs
By STEVE LOHR
News of the cuts comes a week after the company described sweeping changes that will shift
resources to selling cloud-computing services.
Jobs Report: What to Watch For
By PATRICIA COHEN5:00 AM ET
The government’s June report, at 8:30 a.m., will shed light on whether wages are picking up and
sidelined workers are rejoining the labor force.
�
 Historical archive . public document