SCP Boston Survey Results topline (PDF)
File information
Title: National Tracking Poll 180336
Author: Morning Consult
This PDF 1.6 document has been generated by Alex Dulin / XeLaTeX, and has been sent on pdf-archive.com on 04/04/2018 at 16:06, from IP address 69.198.x.x.
The current document download page has been viewed 218 times.
File size: 107.91 KB (5 pages).
Privacy: public file

File preview
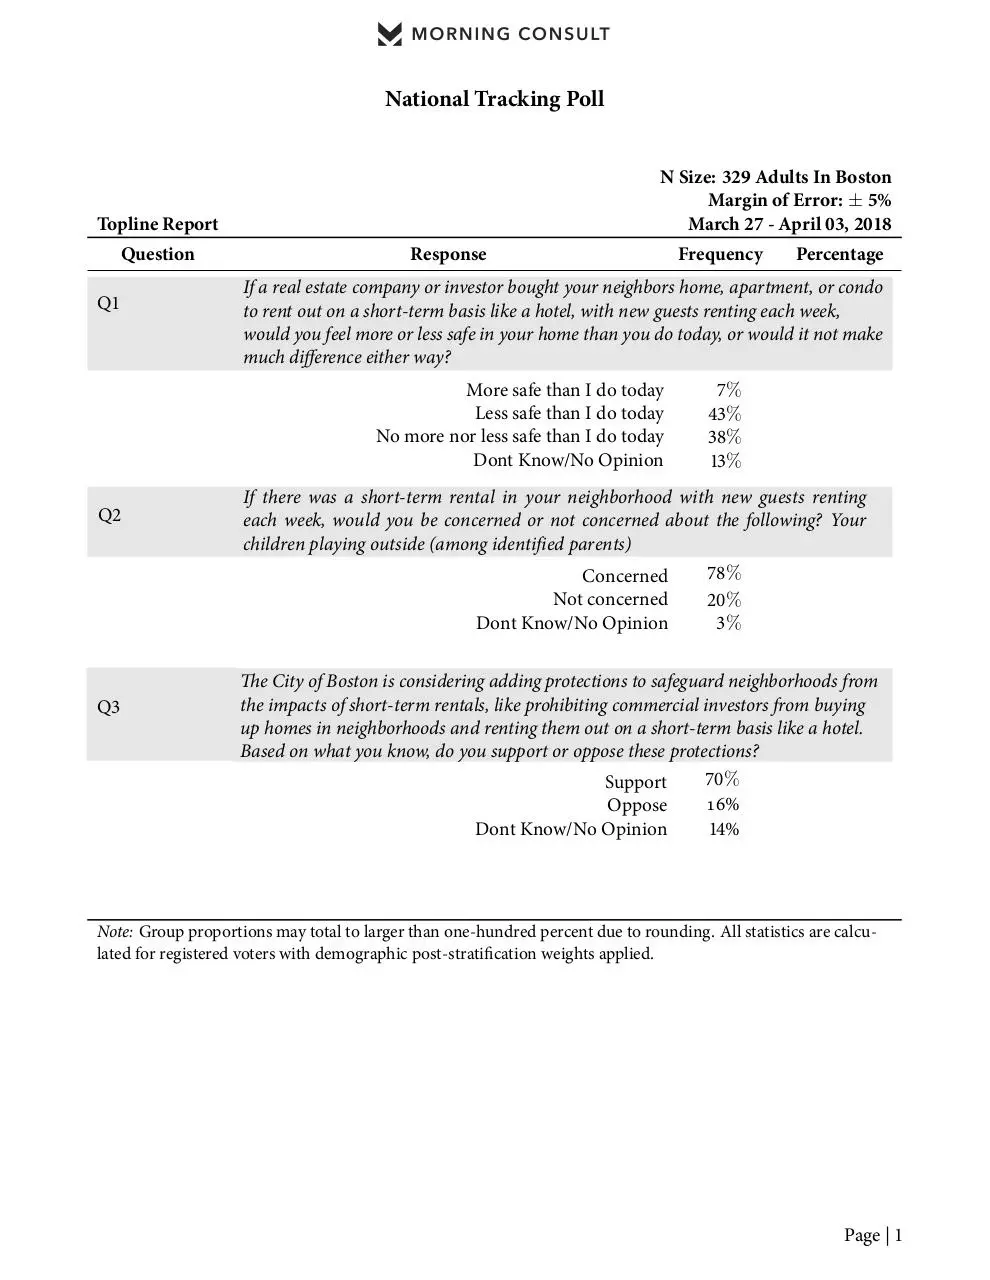
National Tracking Poll
N Size: 329 Adults In Boston
Margin of Error: ± 5%
March 27 - April 03, 2018
Topline Report
Question
Q1
Response
7%
43%
38%
3%
If there was a short-term rental in your neighborhood with new guests renting
each week, would you be concerned or not concerned about the following? Your
children playing outside (among identified parents)
Concerned
Not concerned
Dont Know/No Opinion
Q3
Percentage
If a real estate company or investor bought your neighbors home, apartment, or condo
to rent out on a short-term basis like a hotel, with new guests renting each week,
would you feel more or less safe in your home than you do today, or would it not make
much difference either way?
More safe than I do today
Less safe than I do today
No more nor less safe than I do today
Dont Know/No Opinion
Q2
Frequency
78%
20%
3%
The City of Boston is considering adding protections to safeguard neighborhoods from
the impacts of short-term rentals, like prohibiting commercial investors from buying
up homes in neighborhoods and renting them out on a short-term basis like a hotel.
Based on what you know, do you support or oppose these protections?
70%
Support
16%
Oppose
Dont Know/No Opinion
4%
Note: Group proportions may total to larger than one-hundred percent due to rounding. All statistics are calculated for registered voters with demographic post-strati cation weights applied.
Page | 1
Morning Consult
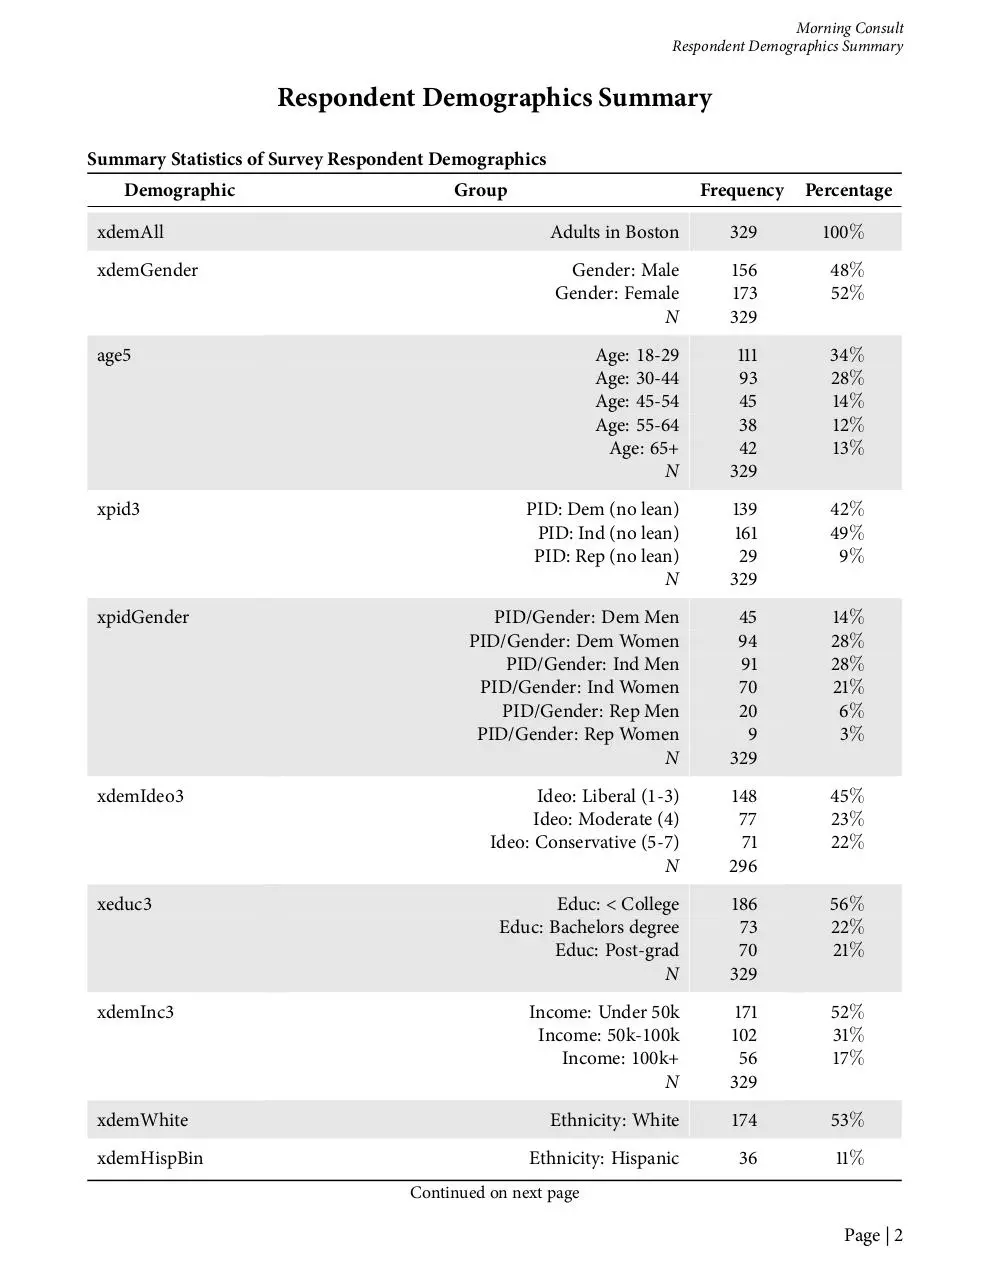
Respondent Demographics Summary
Respondent Demographics Summary
Summary Statistics of Survey Respondent Demographics
Demographic
Group
Frequency
Percentage
xdemAll
Adults in Boston
329
00%
xdemGender
Gender: Male
Gender: Female
N
56
73
329
48%
52%
Age: 18-29
Age: 30-44
Age: 45-54
Age: 55-64
Age: 65+
N
93
45
38
42
329
34%
28%
4%
2%
3%
PID: Dem (no lean)
PID: Ind (no lean)
PID: Rep (no lean)
N
39
6
29
329
42%
49%
9%
xpidGender
PID/Gender: Dem Men
PID/Gender: Dem Women
PID/Gender: Ind Men
PID/Gender: Ind Women
PID/Gender: Rep Men
PID/Gender: Rep Women
N
45
94
9
70
20
9
329
4%
28%
28%
2%
6%
3%
xdemIdeo3
Ideo: Liberal (1-3)
Ideo: Moderate (4)
Ideo: Conservative (5-7)
N
48
77
7
296
45%
23%
22%
Educ: < College
Educ: Bachelors degree
Educ: Post-grad
N
86
73
70
329
56%
22%
2%
Income: Under 50k
Income: 50k-100k
Income: 100k+
N
7
02
56
329
52%
3%
7%
Ethnicity: White
74
53%
Ethnicity: Hispanic
36
%
age5
xpid3
xeduc3
xdemInc3
xdemWhite
xdemHispBin
Continued on next page
Page | 2
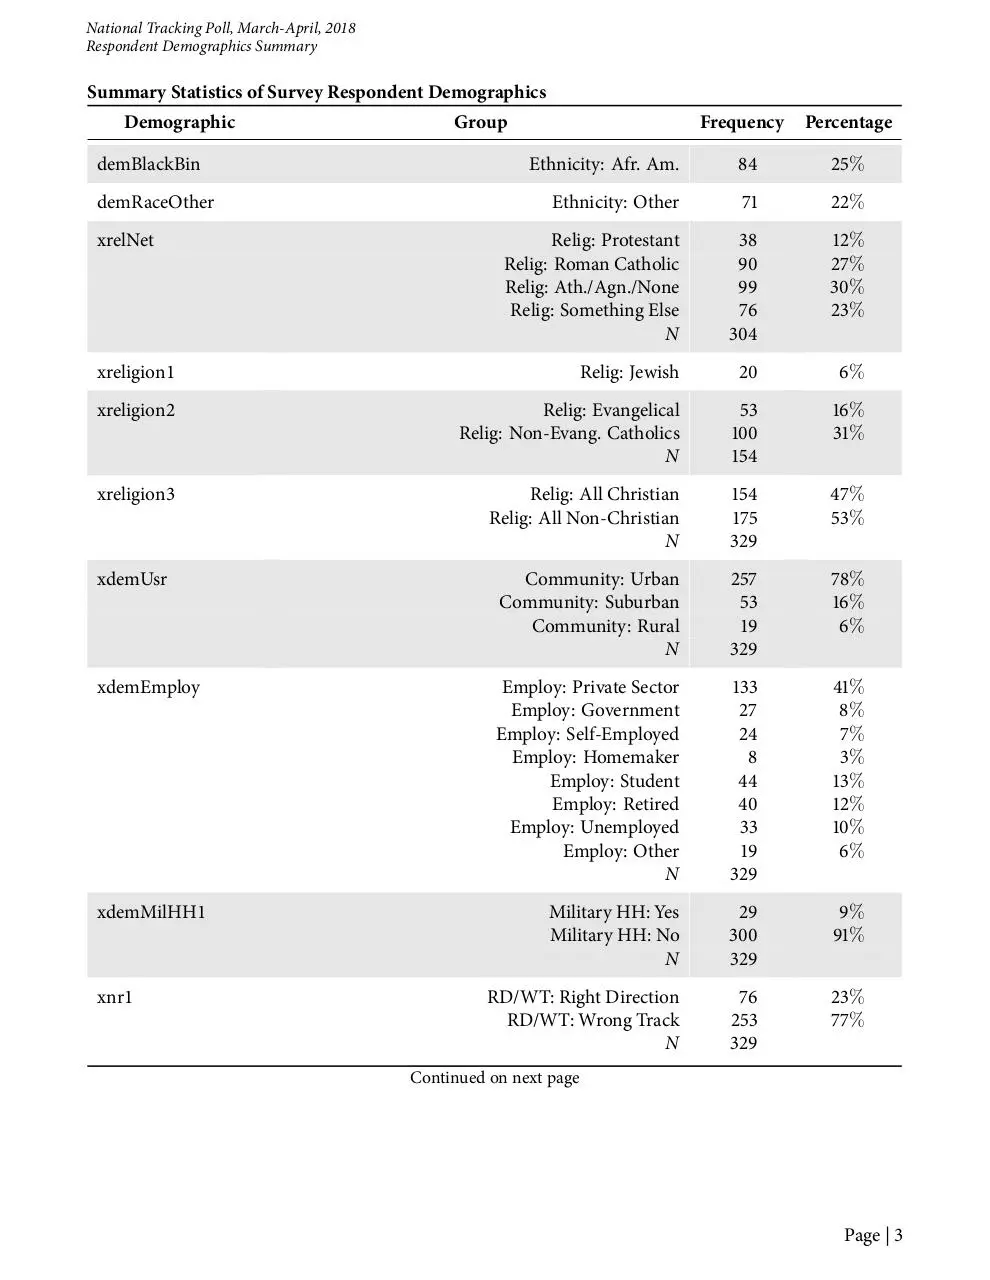
National Tracking Poll, March-April, 2018
Respondent Demographics Summary
Summary Statistics of Survey Respondent Demographics
Demographic
demBlackBin
Group
Frequency
Percentage
Ethnicity: Afr. Am.
84
25%
Ethnicity: Other
7
22%
Relig: Protestant
Relig: Roman Catholic
Relig: Ath./Agn./None
Relig: Something Else
N
38
90
99
76
304
2%
27%
30%
23%
xreligion1
Relig: Jewish
20
6%
xreligion2
Relig: Evangelical
Relig: Non-Evang. Catholics
N
53
00
54
6%
3%
xreligion3
Relig: All Christian
Relig: All Non-Christian
N
54
75
329
47%
53%
xdemUsr
Community: Urban
Community: Suburban
Community: Rural
N
257
53
9
329
78%
6%
6%
xdemEmploy
Employ: Private Sector
Employ: Government
Employ: Self-Employed
Employ: Homemaker
Employ: Student
Employ: Retired
Employ: Unemployed
Employ: Other
N
33
27
24
8
44
40
33
9
329
4%
8%
7%
3%
3%
2%
0%
6%
Military HH: Yes
Military HH: No
N
29
300
329
9%
9%
RD/WT: Right Direction
RD/WT: Wrong Track
N
76
253
329
23%
77%
demRaceOther
xrelNet
xdemMilHH1
xnr1
Continued on next page
Page | 3
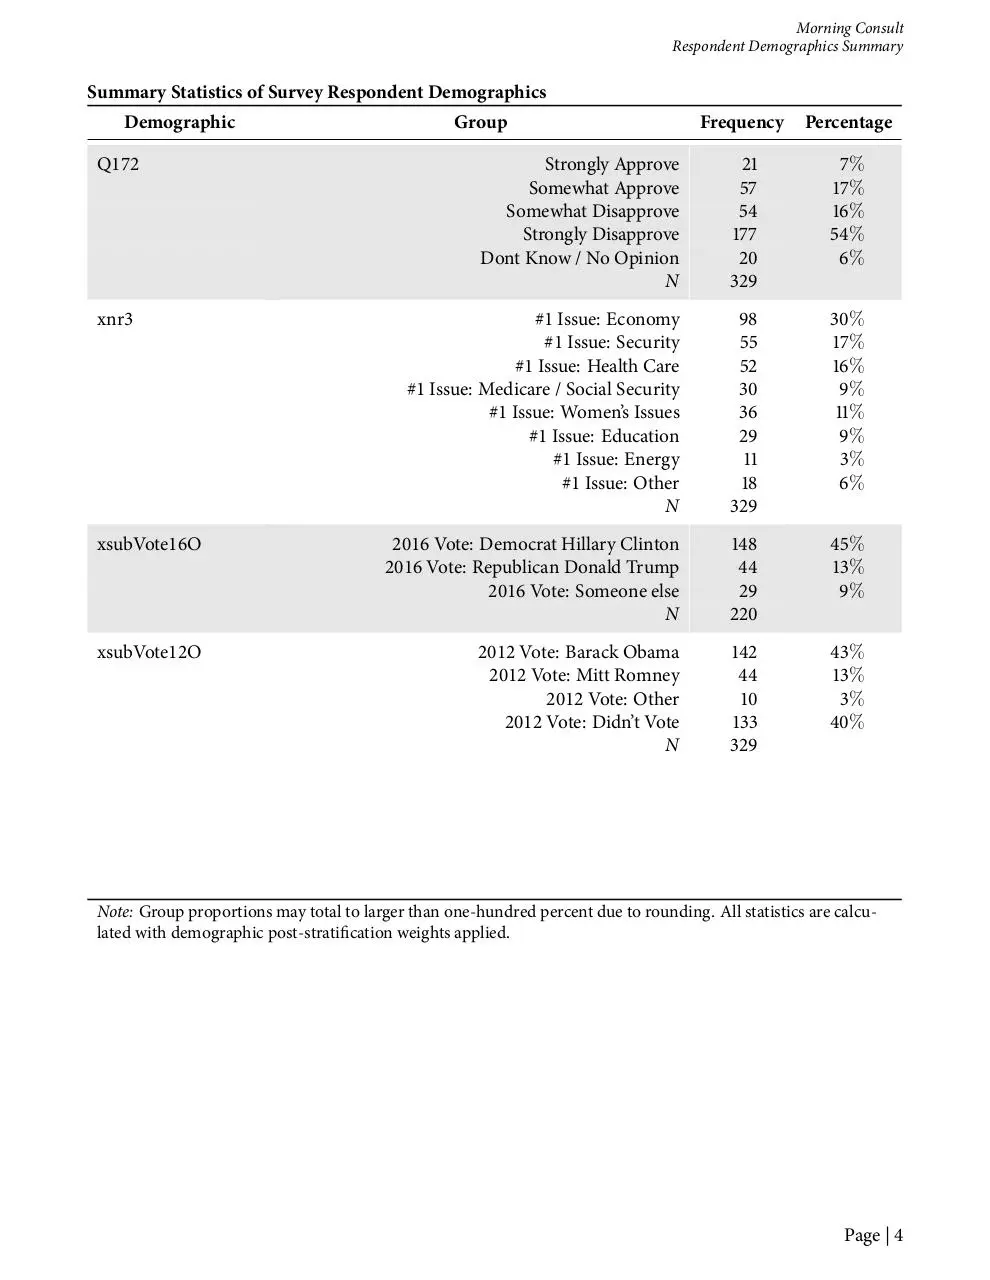
Morning Consult
Respondent Demographics Summary
Summary Statistics of Survey Respondent Demographics
Demographic
Frequency
Percentage
Strongly Approve
Somewhat Approve
Somewhat Disapprove
Strongly Disapprove
Dont Know / No Opinion
N
2
57
54
77
20
329
7%
7%
6%
54%
6%
#1 Issue: Economy
#1 Issue: Security
#1 Issue: Health Care
#1 Issue: Medicare / Social Security
#1 Issue: Women’s Issues
#1 Issue: Education
#1 Issue: Energy
#1 Issue: Other
N
98
55
52
30
36
29
8
329
30%
7%
6%
9%
%
9%
3%
6%
xsubVote16O
2016 Vote: Democrat Hillary Clinton
2016 Vote: Republican Donald Trump
2016 Vote: Someone else
N
48
44
29
220
45%
3%
9%
xsubVote12O
2012 Vote: Barack Obama
2012 Vote: Mitt Romney
2012 Vote: Other
2012 Vote: Didn’t Vote
N
42
44
0
33
329
43%
3%
3%
40%
Q172
xnr3
Group
Note: Group proportions may total to larger than one-hundred percent due to rounding. All statistics are calculated with demographic post-strati cation weights applied.
Page | 4
National Tracking Poll, March-April, 2018
Page | 5
Download SCP Boston Survey Results topline
SCP Boston Survey Results_topline.pdf (PDF, 107.91 KB)
Download PDF
Share this file on social networks
Link to this page
Permanent link
Use the permanent link to the download page to share your document on Facebook, Twitter, LinkedIn, or directly with a contact by e-Mail, Messenger, Whatsapp, Line..
Short link
Use the short link to share your document on Twitter or by text message (SMS)
HTML Code
Copy the following HTML code to share your document on a Website or Blog
QR Code to this page

This file has been shared publicly by a user of PDF Archive.
Document ID: 0000753120.